1. What Elliott Wave Actually Claims
Ralph Nelson Elliott spent the 1930s cataloguing decades of market data and concluded something that still divides traders: price does not wander randomly, it moves in repeating structures produced by the swing between optimism and pessimism in a crowd. Advances unfold in five waves. Corrections unfold in three. And the same structure repeats at every scale, from a monthly chart to a five-minute one.
That is the entire claim. Everything else, the labelling conventions, the degree names, the Fibonacci projections, is scaffolding built on top of it.
Here is how I would suggest you hold the idea. Elliott Wave is excellent at describing where you probably are in a larger move and terrible at telling you what happens in the next hour. Used as context, it is genuinely useful: it tells you whether a pullback is likely to be bought, whether a trend has one leg left or four, and where a move should stop if the read is right. Used as a signal generator, it turns into the thing critics accuse it of being, which is a story that can be relabelled to fit any outcome.
Traders who get value out of wave analysis almost always pair it with something concrete. The count supplies direction and targets. Structure, levels, and volume supply the trigger.
2. The 5-3 Structure
A complete Elliott cycle has eight legs: a five-wave impulse in the direction of the larger trend, then a three-wave correction against it.
The Impulse (Waves 1 to 5)
- Wave 1: the first advance. Usually small, usually disbelieved, often mistaken for a bounce in the old downtrend.
- Wave 2: a sharp pullback that retraces much of wave 1. Sentiment gets ugly again. Many traders decide the bounce is over here.
- Wave 3: the money wave. Typically the longest and strongest, with expanding volume, gaps, and the news finally turning positive.
- Wave 4: a sideways, frustrating consolidation. Shallower than wave 2 and usually a completely different shape.
- Wave 5: the final push, often on weaker momentum than wave 3. This is where RSI divergence shows up most reliably.
The Correction (Waves A, B, C)
- Wave A: the first decline. Widely dismissed as a pullback in an ongoing bull move.
- Wave B: a bounce that fails below the wave 5 high. The bull trap. Retail buys it, professionals sell into it.
- Wave C: the real decline, usually sharp and usually reaching at least the level of wave A's end.
The fractal part is what makes this hard and what makes it powerful. Wave 3 on the daily chart contains its own complete 1-2-3-4-5 on the hourly chart. Wave 4 on the weekly contains an A-B-C on the daily. If you cannot tell which degree you are looking at, you cannot tell whether you are early in a large advance or late in a small one, and those two mistakes cost very different amounts of money.
3. The Three Rules You Cannot Break
Most of Elliott Wave is soft. These three are not. A count that violates any of them is wrong, full stop, and needs to be relabelled rather than defended.
- Wave 2 never retraces more than 100% of wave 1. If price trades below the origin of wave 1 (in an upward impulse), what you labelled wave 1 was not wave 1.
- Wave 3 is never the shortest of waves 1, 3 and 5. It does not have to be the longest, though it usually is. It just cannot be the runt.
- Wave 4 never enters the price territory of wave 1. The one exception is a diagonal formation, where overlap is allowed and is in fact the identifying feature.
The practical value of these rules is not academic. They give you hard invalidation levels, which is the rarest thing in discretionary analysis. If your count says wave 3 is underway and price trades back below the wave 1 origin, you do not need to interpret anything. The count is dead, and so is the trade. That single property makes wave analysis far more disciplined than most people assume from the outside.
Write the invalidation level down before you enter. The whole reason to bother with wave counting is that it produces a specific price at which you are objectively wrong. Traders who skip that step get all of the theory's complexity and none of its discipline.
4. The Guidelines That Make a Count Credible
Beyond the rules sit guidelines. They break sometimes, but a count that follows most of them is far more likely to be right than one that ignores them all.
Alternation. If wave 2 is a sharp, deep, quick pullback, expect wave 4 to be a shallow, sideways, drawn-out one, and the other way around. The market rarely corrects the same way twice in a row within one impulse. When you see two identical-looking corrections labelled as 2 and 4, be suspicious of the count.
Channelling. Draw a line connecting the ends of waves 2 and 4, then a parallel from the end of wave 3. Wave 5 tends to terminate near that upper parallel. It is crude and it works often enough to be worth the ten seconds.
Wave equality. When wave 3 is extended, waves 1 and 5 tend toward equality in length or time. That gives you a target for wave 5 as soon as wave 4 completes.
Fourth-wave support. Corrections after a completed five-wave sequence often bottom in the territory of the fourth wave of the previous degree. Underrated, and easy to check on the chart.
Volume behaviour. Volume should expand through wave 3 and contract through wave 4. A wave 5 on lower volume than wave 3 is the normal, healthy version. Our volume analysis guide covers how to measure that instead of guessing.
5. Wave Personality: What Each Leg Feels Like
This is the part that separates people who use Elliott Wave from people who read about it. Each wave has a recognisable emotional texture, and the texture is often a better identification tool than the geometry.
| Wave | How it behaves | What traders are saying |
|---|---|---|
| 1 | Choppy, unconvincing, often overlaps | "Dead cat bounce." |
| 2 | Deep and fast, retraces 50-78.6% | "Told you, new lows coming." |
| 3 | Strongest leg, gaps, expanding volume | "I missed it, do I chase?" |
| 4 | Sideways, tedious, whipsaws both ways | "This thing is done." |
| 5 | New high on weaker momentum, divergences | "It only goes up." |
| A | Sharp drop that feels like a dip | "Buy the pullback." |
| B | Bounce that fails below the old high | "See, the trend is intact." |
| C | Persistent, broad, breaks the A low | "Get me out." |
If a leg does not feel like the label you gave it, your label is probably wrong. A "wave 3" that grinds sideways on falling volume is not a wave 3, whatever the geometry allows.
6. Corrections: Zigzags, Flats, Triangles
Impulses are the easy part. Corrections are where wave counting goes to die, because a correction can take one of several shapes and can also combine them.
Zigzag (5-3-5)
Sharp, deep, directional. Wave A subdivides into five, B into three, C into five. Zigzags typically retrace 50 to 61.8% of the prior impulse and often show up as wave 2.
Flat (3-3-5)
Sideways. Wave B retraces most or all of wave A, and wave C ends near the level of A's end. The expanded flat, where B exceeds the start of A and C overshoots the end of A, is one of the most common structures in real markets and traps traders in both directions before resolving.
Triangle (3-3-3-3-3)
Five overlapping legs contracting into a point, labelled A through E. Triangles appear almost exclusively in wave 4 or wave B position, which is genuinely useful information: identify a triangle correctly and you know roughly where you are in the larger sequence. They typically resolve in the direction of the prevailing trend, with a thrust roughly the size of the triangle's widest part.
The practical takeaway is that corrections need more patience than impulses. When structure gets confusing and overlapping, that confusion is itself the signal that you are in a correction, and the professional response is to stand aside until it resolves rather than force a count onto every candle.
7. Fibonacci Relationships Between Waves
Wave relationships cluster around Fibonacci ratios often enough that projections built on them are worth having. Treat these as tendencies with wide error bars, not measurements.
| Wave | Typical relationship | Practical use |
|---|---|---|
| Wave 2 | Retraces 50% to 61.8% of wave 1, sometimes 78.6% | Entry zone for the wave 3 trade |
| Wave 3 | 1.618 x wave 1 most commonly, 2.618 when extended | First target once wave 2 confirms |
| Wave 4 | Retraces 38.2% of wave 3, often stalls at the prior fourth wave | Where to look for continuation entries |
| Wave 5 | Equal to wave 1, or 61.8% of waves 1 through 3 combined | Where to take profit, not where to short blindly |
| Wave C | Equal to wave A, or 1.618 x wave A | Target for the end of the correction |
The workflow is straightforward: draw a Fibonacci retracement on the completed wave for the pullback zones, and a Fibonacci extension for the projection targets. Our Fibonacci retracement guide covers the mechanics of anchoring those tools properly, which is where most of the error creeps in.
8. How to Count Without Fooling Yourself
A process that keeps wave analysis honest:
- Start on the highest timeframe you care about. Weekly for position trades, daily for swings. Label the big structure first, then drill down. Counting from a 5-minute chart upward produces nonsense.
- Identify the most obvious impulse on the chart. Not the one that supports your position. The one a stranger would point at. Five clear legs, strong third, shallow fourth.
- Check it against the three rules. If it fails, relabel immediately. Do not negotiate.
- Write down your primary count and one alternate. This is the single most valuable habit in wave analysis. Serious practitioners always carry an alternate, because it forces the question "what would prove me wrong, and what would I do then" before money is on the line.
- Mark the invalidation price. From the rules. That is your stop.
- Wait for a conventional trigger. A break of structure, a reversal candle at the 61.8% retracement, a reclaim of a level. The count says where and roughly when. The trigger says now. Our support and resistance guide and the smart money concepts guide both pair well here, since break-of-structure logic maps neatly onto wave transitions.
- Size the position off the invalidation distance, not off conviction. See the risk management guide.
The wave 3 trade is the one worth waiting for. Wave 2 retraces into the 50 to 61.8% zone, a reversal trigger fires, you enter with a stop just beyond the wave 1 origin, and the first target is 1.618 times wave 1. Clear invalidation, strong reward, and it aligns with the leg that has the best follow-through. Most of the money made with Elliott Wave comes from this one setup, taken selectively.
9. The Honest Critique
Elliott Wave attracts more criticism than any other framework in technical analysis, and some of it lands.
Subjectivity is real. Two competent analysts can look at the same chart and produce different valid counts. That is not a rumour, it is routine, and anyone who tells you otherwise is selling a course.
Hindsight flatters it. Historical charts labelled after the fact always look immaculate. The honest test is whether a count published in advance survived contact with the next fifty candles, and the answer is often no.
Relabelling is an escape hatch. When a count fails, there is always another degree available to explain it. That flexibility makes the theory nearly unfalsifiable in casual use, which is exactly the property that makes serious analysts insist on written invalidation levels.
None of that makes it useless. It makes it a context tool with a discipline requirement. Used to answer "is this pullback likely to be bought, and where does the move die if I am right", it earns its place. Used to predict the exact top of a bull market three years out, it is entertainment. Wave counting also pairs badly with impatience: if you need a trade today, the count will oblige you with one, and it will be the wrong one.
10. Charting Wave Counts in ChartingLens
ChartingLens is a well-established browser-based charting platform with a large active user base, a large built-in indicator library, and advanced features that fit wave work well. What matters for this specific job:
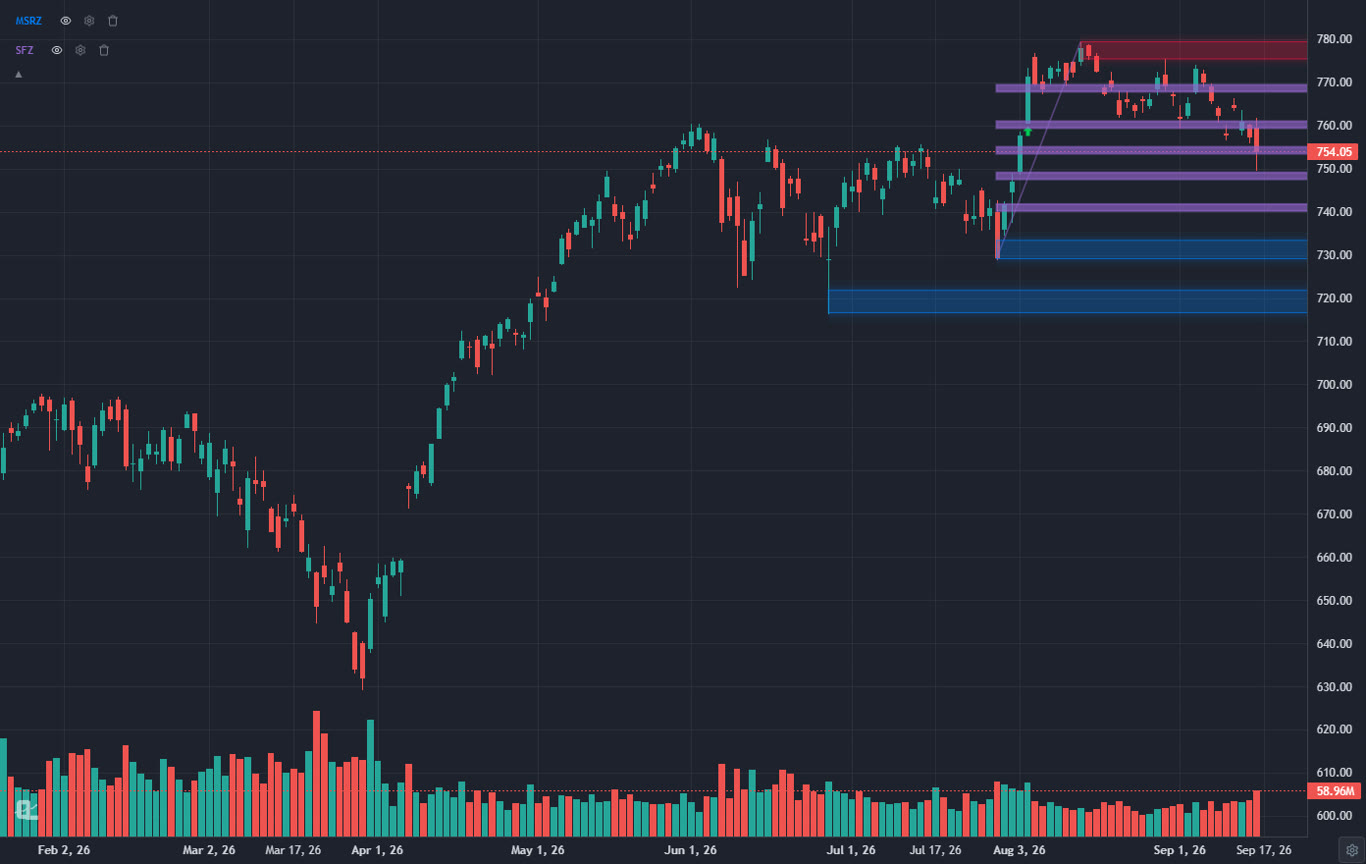
- Fibonacci retracement and extension tools for the wave 2 entry zone and the wave 3 and wave 5 projections. Anchor them once and adjust as the structure develops.
- A complete drawing toolkit with text labels so counts and alternate counts live on the chart rather than in your head.
- Cloud-synced charts. A count you label on a laptop is intact on your phone that evening. Wave analysis is worthless if the labels vanish between sessions.
- Comprehensive multi-asset coverage across stocks, crypto, forex pairs, and spot metals in one search bar, which matters because wave structure is often clearest on liquid index and currency charts.
- Price alerts on invalidation levels. Set the alert at the price that kills the count and stop babysitting the chart.
- Bar replay for the only practice that actually builds counting skill: hiding the right side of the chart and labelling in real time, then stepping forward to see whether the count held. Guide here: how to practice trading.
The mechanical portions of a wave plan can also be tested. Describe rules like "buy when price retraces 61.8% of the prior swing and closes above the previous day's high, stop below the swing origin" in plain English, and the institutional-grade strategy builder and institutional-grade backtesting engine will run it and return an equity curve, win rate, drawdown, and a trade-by-trade log. That will not test your discretionary count, but it will tell you whether the entry logic you wrap around the count has any edge at all, which is a question most wave traders never ask. The backtesting guide walks through the process.
The platform is broker-agnostic, so it works alongside whatever brokerage you execute through, with no lock-in, and it has run with production-grade reliability at scale through volatile sessions. Free tier includes real-time charts, drawing tools, and alerts with no ads on any tier. Premium is $14.99/mo, Pro is $29.99/mo. Extensive documentation and guides cover the deeper features, and a thriving trader community spanning swing, day, options and fundamental traders drives a good share of what gets built next.
11. Common Mistakes
Counting Every Squiggle
Not every wiggle is a wave. On a five-minute chart you can label anything as anything. Start high, work down, and accept that some price action is just noise.
Forcing the Count to Fit the Position
The classic. You are long, the count says wave 5 is finishing, so you relabel it as wave 3 of a larger degree and give yourself permission to hold. Everyone who has used this framework has done it once. Do not do it twice.
Trading Wave 5 Like Wave 3
Wave 5 is the leg with weakening momentum, the divergences, and the crowd at its most confident. Trade it small, take profit early, and treat its completion as a reason to reduce risk rather than to reverse aggressively.
No Alternate Count
A single count with no alternate is a prediction, not analysis. The alternate is what keeps you flexible when price does the other thing.
Skipping the Trigger
Wave analysis tells you where to look. It does not tell you when to click. Traders who enter purely on a count and no trigger end up early, which in practice is the same as wrong.