What Are Smart Money Concepts (SMC)?
Smart money concepts (SMC) is a trading methodology built around one central idea: retail traders lose money because they trade against institutional players. Banks, hedge funds, pension funds, and market makers — collectively known as "smart money" — control the vast majority of volume in financial markets. They do not trade the way retail traders do. They cannot simply click a button and buy 10 million shares at market price. Instead, they use sophisticated strategies to accumulate and distribute positions over time, and those strategies leave identifiable footprints on price charts.
SMC trading is the practice of reading those footprints. Instead of relying solely on traditional technical indicators like RSI, MACD, or moving averages, SMC traders study price action through the lens of institutional behavior. They look for order blocks where institutions placed large orders, fair value gaps where aggressive institutional buying or selling created price imbalances, liquidity pools where retail stop losses cluster, and shifts in market structure that signal a change in institutional intent.
The methodology draws heavily from the work of traders who studied inner circle trader (ICT) concepts and Wyckoff theory. While the terminology is relatively modern, the underlying principles are rooted in decades of market microstructure research. Smart money concepts explained in simple terms means this: understand what the big players are doing, and position yourself on the same side.
What makes SMC particularly relevant in 2026 is the accessibility of tools that can detect these patterns. Manually identifying order blocks, fair value gaps, and liquidity sweeps across multiple timeframes used to take hours. Today, AI-powered platforms can surface these patterns in seconds, making institutional trading strategy analysis available to individual traders for the first time.
How Institutional Traders Move the Market
Before diving into the specific tools and patterns of SMC trading, you need to understand why institutional traders behave differently from retail traders. This is the foundation that makes smart money concepts work.
A retail trader might buy 100 shares of a stock with a single market order. The order fills instantly at the current price with negligible market impact. An institutional trader managing a billion-dollar portfolio faces a completely different problem. If a hedge fund wants to build a position of 5 million shares in a mid-cap stock, placing that as a single market order would move the price dramatically against them before the order finished filling. They would end up buying most of their shares at inflated prices.
Instead, institutions use a process called accumulation and distribution. During accumulation, they buy shares slowly over time, often in a specific price range. They may even push price down temporarily to trigger retail stop losses, creating a flood of sell orders that they absorb as cheap shares. This is why you often see price dip below a key support level, trigger a cascade of stops, and then immediately reverse upward. That reversal is not random. It is the institutional order absorbing the liquidity created by the stop run.
The Three Phases of Institutional Activity
- Accumulation: Smart money quietly builds a position over time, usually within a range-bound market. Price moves sideways as institutions absorb shares without alerting the market. This phase often looks boring on a chart — tight ranges, low volatility, overlapping candles.
- Manipulation: Before the real move begins, institutions engineer a false move in the opposite direction. This is the "spring" in Wyckoff terminology or the "liquidity grab" in SMC language. The purpose is to trigger retail stop losses and create liquidity that institutions can trade against. You will often see a sharp spike below support or above resistance that reverses quickly.
- Distribution/Expansion: Once institutions have their full position, they allow — or drive — price in the intended direction. This is the impulsive move that produces large candles and strong momentum. Retail traders who entered late in this phase are providing exit liquidity for institutions who accumulated at lower prices.
Understanding this three-phase cycle is essential for smart money trading. Every SMC pattern — order blocks, fair value gaps, liquidity sweeps, market structure shifts — is a manifestation of one of these phases. When you learn to identify which phase the market is in, your entries and exits improve dramatically.
Market Structure: Break of Structure (BOS) and Change of Character (CHoCH)
Market structure is the backbone of SMC analysis. Before you look for order blocks or fair value gaps, you need to know the market's current structural trend. Market structure in SMC is defined by the sequence of swing highs and swing lows on any timeframe.
Bullish Market Structure
In a bullish market structure, price creates a series of higher highs (HH) and higher lows (HL). Each swing high exceeds the previous swing high, and each swing low holds above the previous swing low. This tells you that buyers are in control and institutions are likely still accumulating or distributing at higher prices. As long as this pattern of higher highs and higher lows remains intact, the bullish structure is valid.
Bearish Market Structure
In a bearish market structure, price creates a series of lower lows (LL) and lower highs (LH). Each swing low drops below the previous swing low, and each swing high fails to reach the previous swing high. Sellers are in control, and institutions are distributing or accumulating short positions.
Break of Structure (BOS)
A break of structure (BOS) occurs when price breaks a recent swing high or swing low in the direction of the current trend. In a bullish trend, a BOS happens when price breaks above the most recent swing high, creating a new higher high. In a bearish trend, a BOS happens when price breaks below the most recent swing low, creating a new lower low. A BOS confirms that the existing trend is continuing. It is a continuation signal, not a reversal signal.
BOS is important because it tells you that institutional intent has not changed. If you are trading long in a bullish structure, each BOS validates your directional bias. You look for entries at the pullbacks to higher lows after BOS confirms the move.
Change of Character (CHoCH)
A change of character (CHoCH) is the first sign that the market structure may be reversing. In a bullish trend, a CHoCH occurs when price breaks below the most recent higher low. In a bearish trend, a CHoCH occurs when price breaks above the most recent lower high. This break against the trend signals that the opposing side — buyers in a downtrend or sellers in an uptrend — has gained enough strength to violate the structure.
A CHoCH does not guarantee a full reversal. Sometimes it leads to a range-bound consolidation before the original trend resumes. However, it is the earliest warning signal that smart money may be shifting direction. Many SMC traders wait for a CHoCH on a higher timeframe before looking for entries on a lower timeframe, using it as a directional filter.
Identifying market structure shifts is one of the most time-consuming aspects of manual SMC analysis. AI-powered support and resistance tools can accelerate this by automatically identifying key swing points and structural levels across multiple timeframes.
Order Blocks: Where Institutions Enter Trades
An order block is one of the most important concepts in smart money trading. It represents the last opposing candle before a strong impulsive move — the specific price zone where institutional orders were placed. When price returns to an order block, there is a high probability that it will react, because unfilled institutional orders may still exist at that level.
Bullish Order Block
A bullish order block is the last bearish (red/down) candle before a strong bullish impulse that breaks structure to the upside. The logic: that bearish candle represents the final wave of selling before institutions stepped in with massive buy orders. The body and wick of that candle define the order block zone. When price retraces to this zone, institutional buy orders that were not fully filled on the initial move may absorb selling pressure and push price back up.
Bearish Order Block
A bearish order block is the last bullish (green/up) candle before a strong bearish impulse that breaks structure to the downside. This was the final burst of buying before institutional sell orders overwhelmed demand. The order block zone is defined by that candle's body and wick. When price returns to this zone, expect selling pressure from unfilled institutional orders.
What Makes an Order Block Valid
Not every candle before a move is a legitimate order block. For an order block to be considered high-probability in an SMC strategy, it should meet several criteria:
- The impulse move must break structure. A move away from the candle that does not break a swing high or low may not represent genuine institutional activity.
- The impulse should create a fair value gap. If the move away from the order block is strong enough to leave a fair value gap, it confirms aggressive institutional participation.
- The order block should be unmitigated. An order block is "mitigated" when price returns to it and fills through the zone. Unmitigated order blocks — those that have not been revisited — carry the highest probability of a reaction.
- Higher timeframe order blocks carry more weight. A daily order block is more significant than a 5-minute order block because it represents larger institutional positions.
For a deeper exploration of order block identification, entry techniques, and risk management, see our dedicated order blocks trading guide.
Fair Value Gaps (FVG): Finding Price Imbalances
A fair value gap (FVG) is a three-candle pattern that reveals price imbalance — an area where aggressive buying or selling moved price so quickly that not all orders were filled. FVGs are visible as gaps between the wicks of the first and third candles in the sequence. They are one of the most reliable SMC patterns because they have a clear, structural definition with no subjectivity.
Bullish Fair Value Gap
A bullish FVG forms when the low of the third candle is above the high of the first candle. The middle candle is a large bullish candle that created the gap. The space between the first candle's high and the third candle's low is the fair value gap. Price tends to retrace into this gap to "rebalance" the inefficiency before continuing higher. Institutional buyers who missed the initial move often have resting orders within the FVG.
Bearish Fair Value Gap
A bearish FVG forms when the high of the third candle is below the low of the first candle. The middle candle is a large bearish candle. The gap between the first candle's low and the third candle's high is the fair value gap. Price often retraces up into this gap before continuing lower.
Trading Fair Value Gaps
FVGs serve multiple purposes in smart money concepts trading:
- Entry zones: When price retraces into an FVG that aligns with your directional bias, it provides a precise entry point with a clearly defined invalidation level.
- Confluence with order blocks: An FVG that overlaps with an order block creates a high-probability zone. The order block provides the institutional context, and the FVG provides the price imbalance that draws price back.
- Targets: Unfilled FVGs above or below current price act as magnets. Price has a natural tendency to fill gaps, making them useful for setting profit targets.
- Trend strength measurement: In a strong trend, FVGs form frequently and may only partially fill before price continues. In a weakening trend, FVGs fill completely and price struggles to create new ones.
Fair value gaps are one of the easiest SMC patterns to automate. Rather than manually scanning every three-candle sequence across multiple assets and timeframes, you can use AI tools to detect them instantly. Our complete fair value gaps guide walks through advanced FVG strategies including consequent encroachment, inversion FVGs, and multi-timeframe FVG analysis.
Supply and Demand Zones in SMC
Supply and demand zones are broader areas on a chart where significant buying (demand) or selling (supply) pressure has historically occurred. While the concept overlaps with traditional support and resistance levels, SMC traders define these zones more precisely using price action clues about institutional activity.
Demand Zones
A demand zone is a price area where institutional buyers previously overwhelmed sellers, causing a strong move upward. In SMC, demand zones are typically identified by a basing pattern (tight consolidation with small candles) followed by an explosive bullish move. The consolidation area represents the demand zone — the range where institutions were accumulating. When price returns to a demand zone, the expectation is that those buyers will defend their positions, causing price to bounce.
Supply Zones
A supply zone is the opposite — a price area where institutional sellers previously overwhelmed buyers, causing a strong move downward. It is identified by a consolidation or minor rally followed by an aggressive bearish impulse. When price returns to a supply zone, sellers are expected to step back in.
How Supply and Demand Zones Differ from Order Blocks
The distinction is important. An order block is a single candle — the last opposing candle before an impulsive move. A supply or demand zone is a broader area that may encompass multiple candles and represents the general region of institutional interest. Order blocks are more precise and are often located within a larger supply or demand zone. Advanced SMC traders use the supply or demand zone as the area of interest and the order block within it as the specific entry trigger.
Zone Quality Factors
Not all supply and demand zones are equal. Higher quality zones share these characteristics:
- Fresh zones: Zones that have never been tested since formation carry more unfilled orders than zones that have been tested multiple times.
- Strong departure: The more explosive the move away from the zone, the more institutional participation it signals.
- Time at the zone: A tight, brief consolidation before departure suggests urgency and is more bullish/bearish than a wide, prolonged consolidation.
- Alignment with higher timeframe structure: A demand zone on the 15-minute chart that sits inside a daily demand zone has much higher confluence than one that sits inside a daily supply zone.
Liquidity: Sweeps, Grabs, and Why They Matter
Liquidity is the concept that ties all of smart money concepts together. In SMC, liquidity refers to clusters of resting orders — primarily stop losses and pending orders — that sit at predictable price levels. Institutions need liquidity to fill their large orders, and they engineer price moves specifically to access it. Understanding liquidity is what separates SMC trading from basic support and resistance analysis.
Where Liquidity Rests
Retail traders place their stop losses in predictable locations. SMC traders know exactly where to look:
- Below swing lows: Traders who are long place stops below recent swing lows. This creates a pool of sell-stop orders (which become market sell orders when triggered) that institutions can use as buy-side liquidity.
- Above swing highs: Traders who are short place stops above recent swing highs, creating buy-stop orders that become sell-side liquidity for institutions wanting to sell.
- Below equal lows: When price forms two or more lows at approximately the same level, retail traders see "double bottom support" and pile in long positions with stops just below. This concentrated cluster of stops is extremely attractive liquidity for institutions.
- Above equal highs: Similarly, equal highs look like "double top resistance" to retail traders, who short with stops above. This creates a dense liquidity pool above the highs.
- Around round numbers: Psychological levels like $100, $50, $200 attract order clustering from retail traders who use round numbers for entries, stops, and targets.
Liquidity Sweeps
A liquidity sweep occurs when price moves through a key level — sweeping the resting stop orders — and then reverses. The sweep triggers a cascade of stops, which generates the volume institutions need to fill their positions in the opposite direction. On a chart, a liquidity sweep often looks like a wick that extends beyond a swing high or low before closing back inside the range.
For example, in a bullish scenario: price has been forming higher lows with a clear swing low that retail traders are using as a stop level. Smart money pushes price below that swing low, triggering all the sell stops. Those sell orders flood the market, and institutions absorb them as cheap buy orders. Price then reverses sharply upward, leaving a long wick below the swing low. This is a textbook liquidity sweep and is one of the highest-probability entry signals in smart money concepts trading.
Liquidity Grabs vs. Legitimate Breakouts
The critical skill in SMC trading is distinguishing a liquidity grab (a false breakout designed to sweep stops) from a legitimate breakout (a real structural break). Several clues help:
- Speed of reversal: Liquidity grabs reverse quickly, often within one or two candles. Legitimate breakouts hold and build.
- Context: A sweep into a higher timeframe order block or demand zone is more likely a liquidity grab. A sweep with no structural reason to reverse may be a real breakout.
- Volume: Liquidity grabs often show a volume spike on the sweep candle followed by declining volume, while legitimate breakouts maintain volume.
- Candle close: If price sweeps a level but closes back inside the range, it favors a grab. If price closes decisively beyond the level, it favors a breakout.
How to Trade Smart Money Concepts (Step-by-Step)
Now that you understand the individual components, here is how to combine them into a complete SMC strategy. This is a practical, step-by-step framework for how to trade smart money concepts on any market and timeframe.
Step 1: Identify Higher Timeframe Bias
Start with the daily or 4-hour chart. Determine the market structure — is it bullish (higher highs and higher lows) or bearish (lower lows and lower highs)? Identify any recent BOS or CHoCH. Your higher timeframe bias determines which direction you will trade on lower timeframes. If the daily structure is bullish, you only look for long entries on the 15-minute or 5-minute chart. Do not fight the higher timeframe structure.
Step 2: Mark Key Liquidity Levels
On the higher timeframe, identify where liquidity is resting. Mark equal highs, equal lows, and significant swing points where stops are likely clustered. These are the levels that price is likely to gravitate toward before making a meaningful move. Understanding where liquidity sits tells you where price is likely to go before it reverses.
Step 3: Identify Points of Interest (POIs)
Mark unmitigated order blocks, unfilled fair value gaps, and fresh supply or demand zones on both the higher and lower timeframes. These are your potential entry zones — the areas where you expect price to reach and react. The best POIs have multiple confluences: an order block sitting inside a demand zone with a fair value gap nearby creates a high-probability entry area.
Step 4: Wait for Price to Reach Your POI
This is where discipline matters. Do not chase price. Do not enter early because you think price "looks like" it will reach your zone. Wait until price actually arrives at your point of interest. Many traders lose money because they anticipate the move to the zone rather than waiting for it.
Step 5: Look for a Lower Timeframe Entry Confirmation
Once price reaches your higher timeframe POI, drop to a lower timeframe (5-minute or 1-minute) and look for an entry confirmation. This typically means:
- A CHoCH on the lower timeframe that shifts structure in your favor
- A liquidity sweep followed by a reversal candle
- A lower timeframe order block forming within the higher timeframe POI
- A fair value gap forming on the lower timeframe in the direction of your bias
Step 6: Enter With Defined Risk
Place your entry at the lower timeframe confirmation level. Your stop loss goes beyond the POI — below the order block for longs or above it for shorts. Your target is the next significant liquidity level or the opposite extreme of the range. This gives you a clearly defined risk-to-reward ratio before you enter the trade. Most SMC traders aim for a minimum of 1:3 risk-to-reward.
Step 7: Manage the Trade
Once in the trade, use market structure to manage your position. In a long trade, trail your stop below each new higher low that forms. If price creates a CHoCH against your position, consider reducing or closing the trade. Take partial profits at intermediate liquidity levels and let the remaining position run toward your final target.
This step-by-step process is best practiced in a risk-free environment before using real capital. Bar Replay tools let you practice this exact workflow on historical data, scrolling through price action candle by candle and executing paper trades to build pattern recognition. You can also backtest your SMC strategy systematically to measure whether your specific entry and exit rules produce positive expectancy across hundreds of trades.
How to Detect SMC Patterns Automatically With AI
The biggest challenge with smart money concepts trading is the amount of manual analysis required. Identifying order blocks, fair value gaps, supply and demand zones, market structure shifts, and liquidity levels across multiple timeframes and multiple assets is time-intensive. This is where AI-assisted trading changes the game.
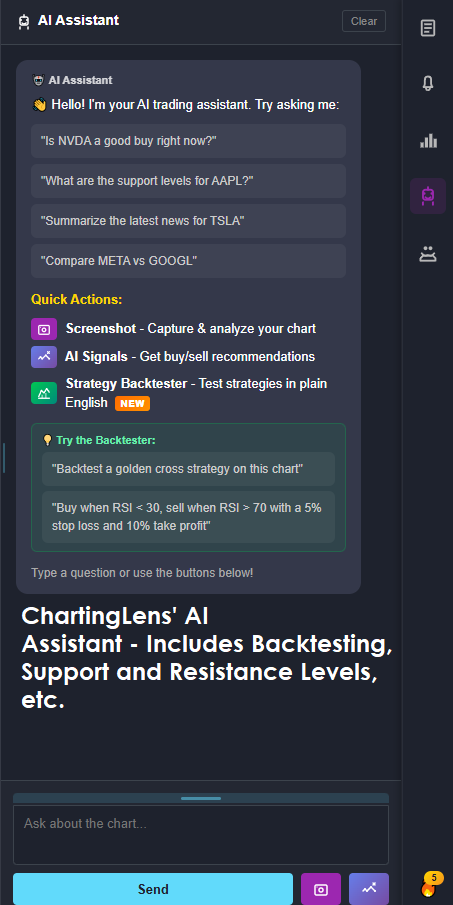
AI-Powered Order Block and FVG Detection
ChartingLens's AI Chat can detect and draw order blocks, fair value gaps, and supply and demand zones directly on your chart. The workflow is simple: open any stock or crypto chart, open the AI Chat, and describe what you want in plain English. Ask it to "show me the key order blocks on this chart" or "highlight unfilled fair value gaps on the daily timeframe," and it will analyze the price action and draw the zones for you in seconds.
This eliminates the most tedious part of SMC analysis. Instead of spending 30 minutes manually marking up a single chart, you can have the AI analyze it instantly and move on to confirming the setup and planning your trade. The AI identifies patterns using the same structural rules that manual SMC traders use — it looks for the last opposing candle before impulsive moves, checks for structure breaks, and validates the pattern against higher timeframe context.
Auto Chart Pattern Recognition
Beyond SMC-specific patterns, ChartingLens automatically detects 13+ chart patterns including head and shoulders, double tops and bottoms, triangles, wedges, and flags. These traditional patterns complement SMC analysis. For instance, a head and shoulders pattern forming at a key supply zone with a bearish order block adds significant confluence to a short setup. The auto-detection means you never miss a pattern forming across your watchlist.
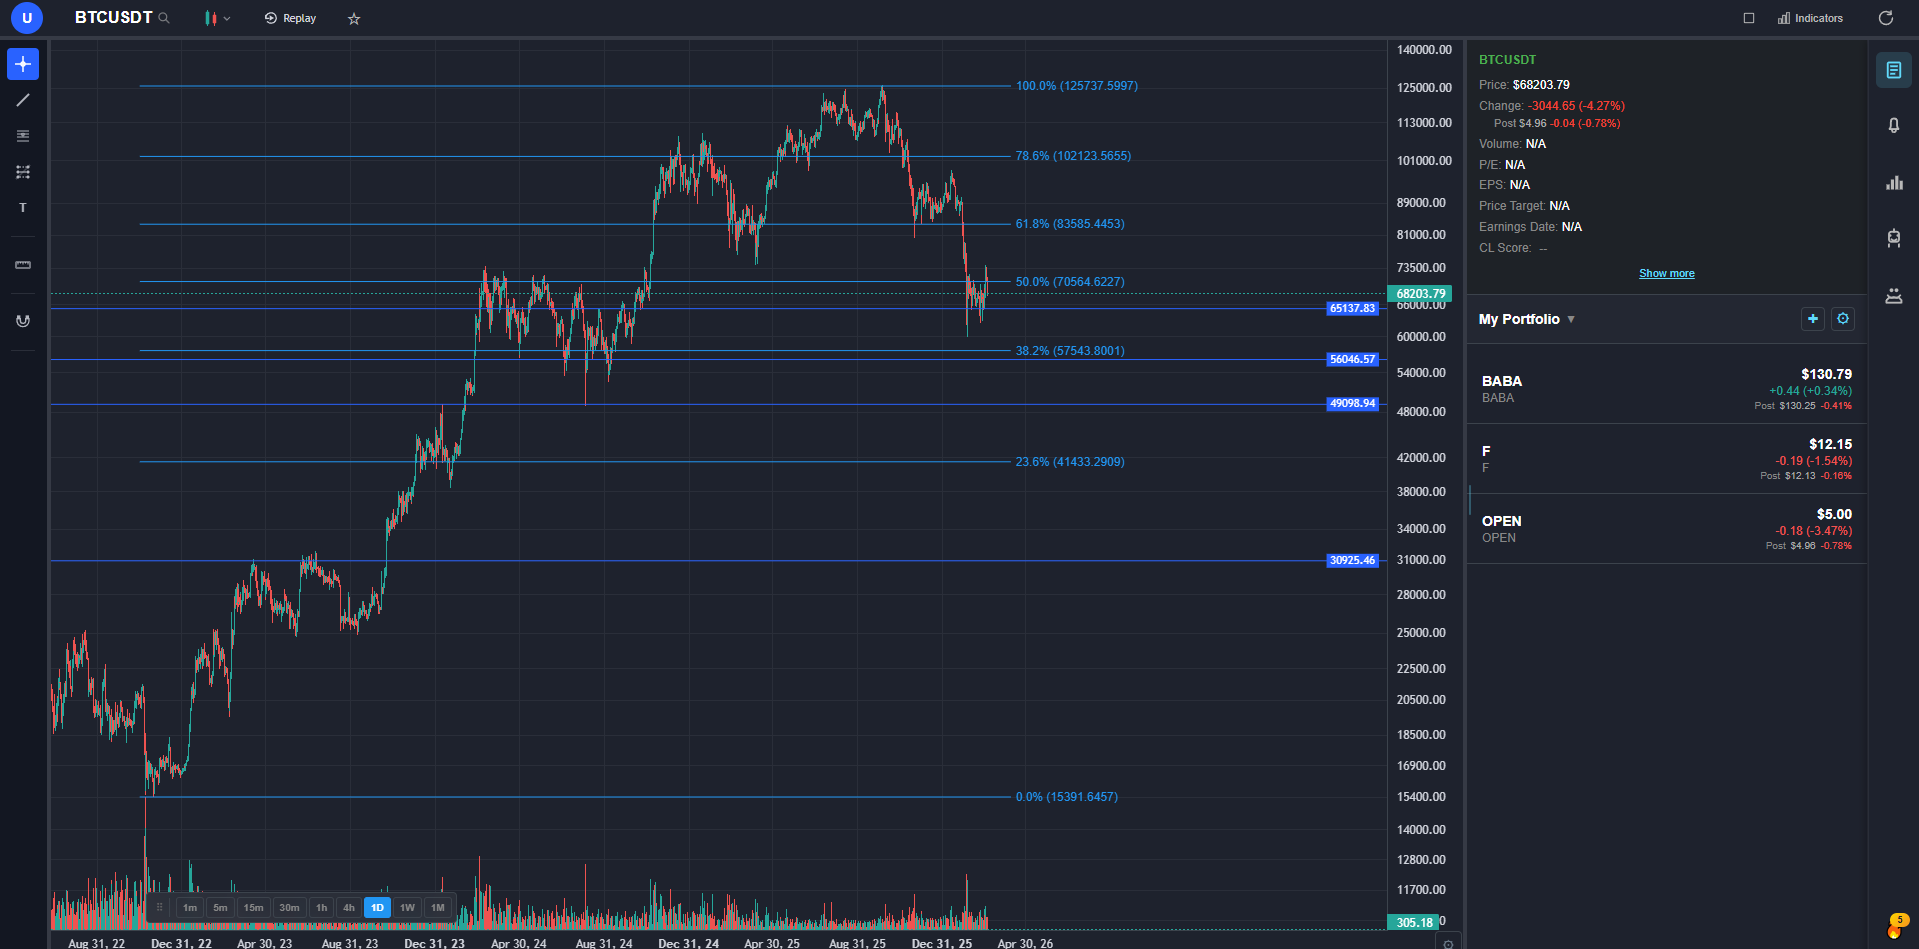
AI-Drawn Support and Resistance
Market structure analysis requires identifying key swing highs and swing lows. ChartingLens's AI can draw support and resistance levels automatically, highlighting the structural levels that define the current trend. These levels serve as the foundation for your BOS and CHoCH identification, helping you determine your higher timeframe directional bias without manual chart markup.
Bar Replay for Practicing SMC Setups
Reading about smart money concepts is one thing. Developing the pattern recognition to identify setups in real time is another. Bar Replay lets you scroll through historical price data candle by candle, practicing your SMC analysis in a risk-free environment. You can identify order blocks, mark fair value gaps, predict where liquidity will be swept, and execute paper trades to test your read — all without risking a dollar. This is how you build the screen time that SMC trading requires.
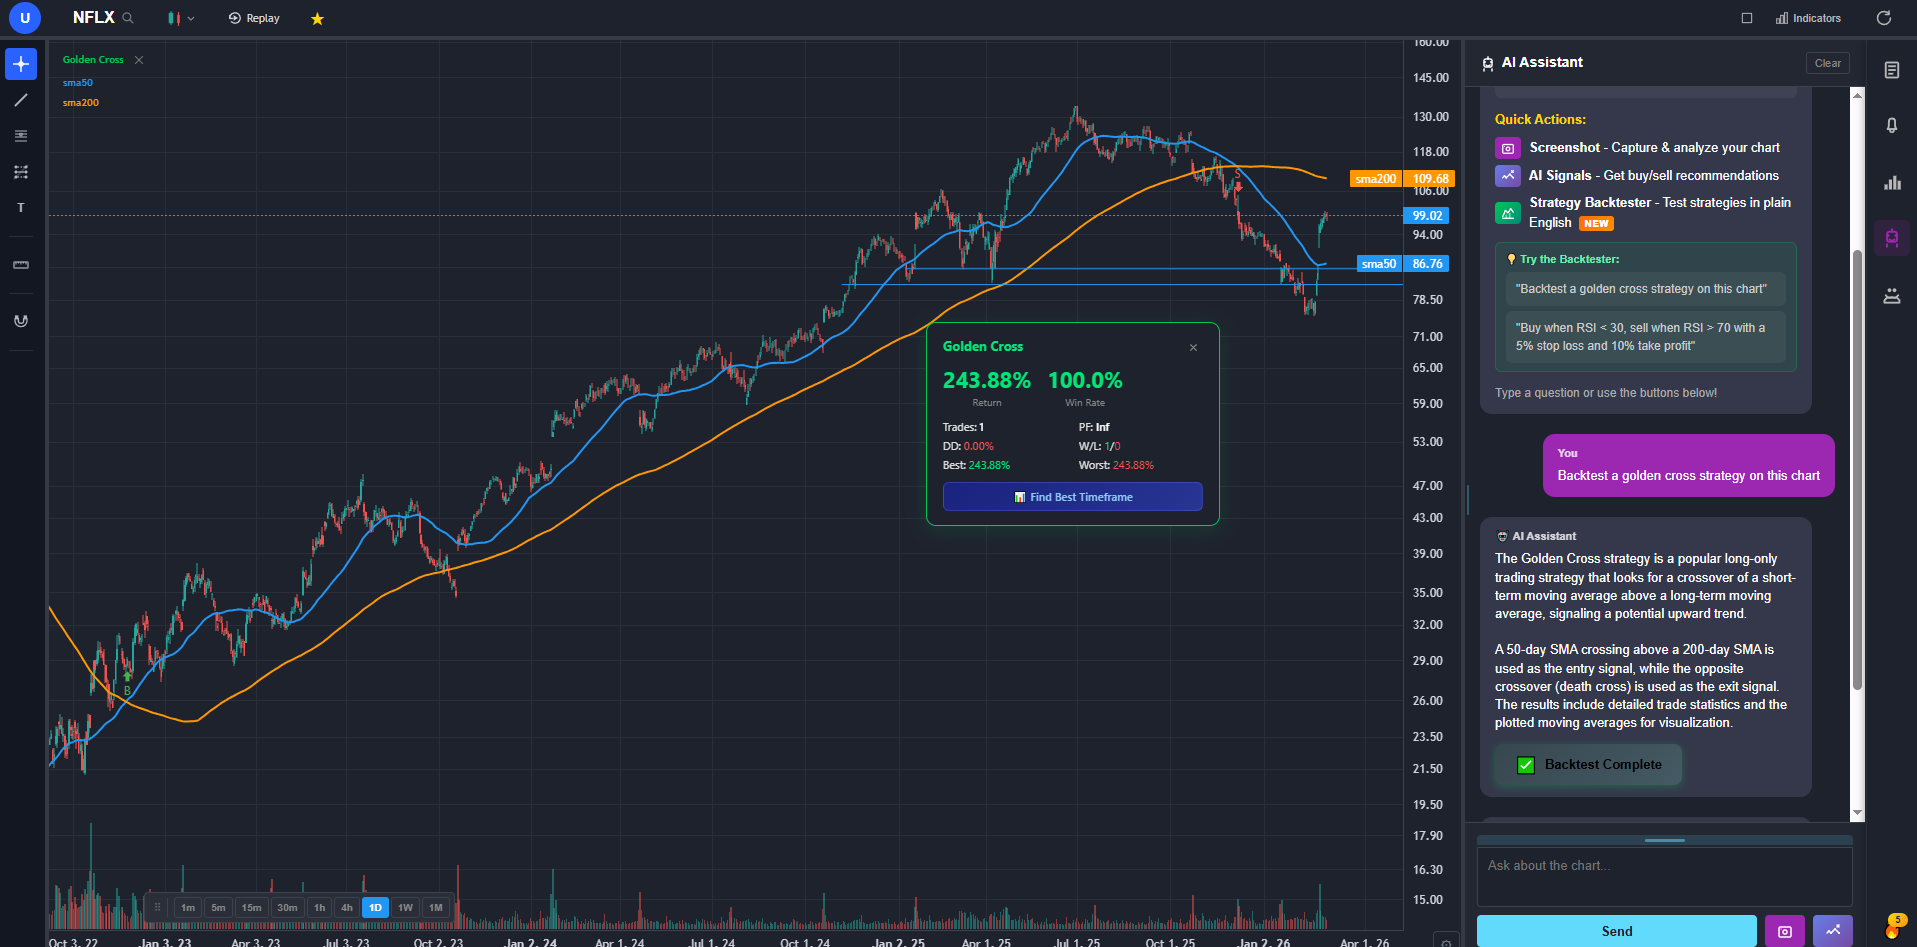
AI Backtesting for SMC Strategies
Before trading any SMC strategy with real money, you need to know whether it has positive expectancy. ChartingLens's plain-English backtester lets you describe your strategy in natural language and test it across historical data. You can test rules like "buy when price retraces to a bullish order block after a break of structure on the daily chart" and see the win rate, average return, and drawdown statistics. This removes the guesswork from strategy development and gives you data-driven confidence in your approach. See our complete guide on how to backtest a trading strategy for a full walkthrough.
Frequently Asked Questions
Related Articles
Ready to Trade Like Smart Money?
Detect order blocks, fair value gaps, and supply and demand zones automatically with AI. Backtest your SMC strategies in plain English. Practice with Bar Replay. All free to start.
Try ChartingLens Free