Why the Right Technical Analysis Tools Matter
Technical analysis is the backbone of active trading. Every time you draw a trendline to define a trend, plot a fibonacci retracement to identify a pullback target, or apply a moving average to filter noise from price action, you are using technical analysis tools to make better decisions. The quality of those tools directly impacts the quality of your analysis and, ultimately, your trading results.
The problem most traders face in 2026 is not a shortage of tools. It is the opposite: there are dozens of charting platforms, each claiming to offer the best drawing tools for stock charts, the most accurate stock pattern recognition software, or the most comprehensive indicator suite. Some of them are genuinely powerful. Many of them paywall their most useful features. And a few offer exceptional value for free if you know where to look.
In this guide, we break down the specific categories of technical analysis tools that matter most, from fibonacci retracement tools and drawing tools for stock charts to auto chart pattern recognition, moving average indicator platforms, and multi-timeframe charting software. For each category, we review the platforms that do it best, with a particular focus on what you can access without paying a cent. Whether you are a day trader who needs fast, precise drawing tools or a swing trader searching for automated pattern detection, this guide will help you find the right platform for your workflow.
We will cover six major tools and platforms throughout this article: ChartingLens, TradingView, Thinkorswim, TrendSpider, StockCharts, and Autochartist. Each excels in different areas, and by the end you will know exactly which one fits your needs.
Essential Drawing Tools for Chart Analysis
Before diving into platform comparisons, it is worth establishing what drawing tools a serious technical analyst actually needs. Not every platform includes every tool, and not all implementations are equal. Here are the core drawing tools for stock charts that should be part of any charting workflow.
Trendlines
Trendlines are the most fundamental drawing tool in technical analysis. By connecting swing lows in an uptrend or swing highs in a downtrend, you create a visual reference for the direction and angle of price movement. A well-drawn trendline can act as dynamic support or resistance, giving you clear entry and exit points. Any charting platform worth using should let you draw trendlines with precision, snap them to candle wicks or bodies, and extend them into the future.
Fibonacci Retracement
The fibonacci retracement tool is essential for measuring pullbacks within a trend. By stretching the tool from a significant swing low to a swing high (or vice versa), you get horizontal levels at the key fibonacci ratios: 23.6%, 38.2%, 50%, 61.8%, and 78.6%. These levels frequently act as support or resistance during retracements, making them invaluable for timing entries on pullbacks. A good free fibonacci retracement tool should be easy to draw, clearly labeled, and allow customization of the displayed ratios.
Parallel Channels
Parallel channels extend the concept of trendlines by adding a second, equidistant line. This creates a trading range that captures the full oscillation of price within a trend. Channels are particularly useful for swing traders who want to buy near the lower boundary and sell near the upper boundary. The best drawing tools let you create channels with a single drag-and-drop gesture and adjust each boundary independently.
Horizontal Lines
Horizontal support and resistance lines mark price levels where buying or selling pressure has historically been strong. These are the simplest drawing tools but among the most powerful. Traders use them to identify breakout levels, stop-loss placements, and profit targets. A solid charting platform should let you place horizontal lines with a single click, color-code them, and optionally add price labels.
Arrows and Annotations
Arrows, text labels, and other annotation tools help you mark up your charts with context. Whether you are noting a key earnings date, flagging a volume spike, or marking a specific candle pattern, annotations make your chart analysis more organized and reviewable. These tools are especially important if you journal your trades or share chart ideas with others.
Now let us examine which platforms offer the best implementations of these tools, starting with the tool that most traders search for first: fibonacci retracement.
Best Free Fibonacci Retracement Tools
Fibonacci retracement is one of the most widely used technical analysis techniques in the world. Traders across every market, from equities and forex to cryptocurrency and commodities, rely on fib levels to gauge how deep a pullback might go before the primary trend resumes. Finding a reliable free fibonacci retracement tool is a top priority for anyone building a charting workflow on a budget.
ChartingLens
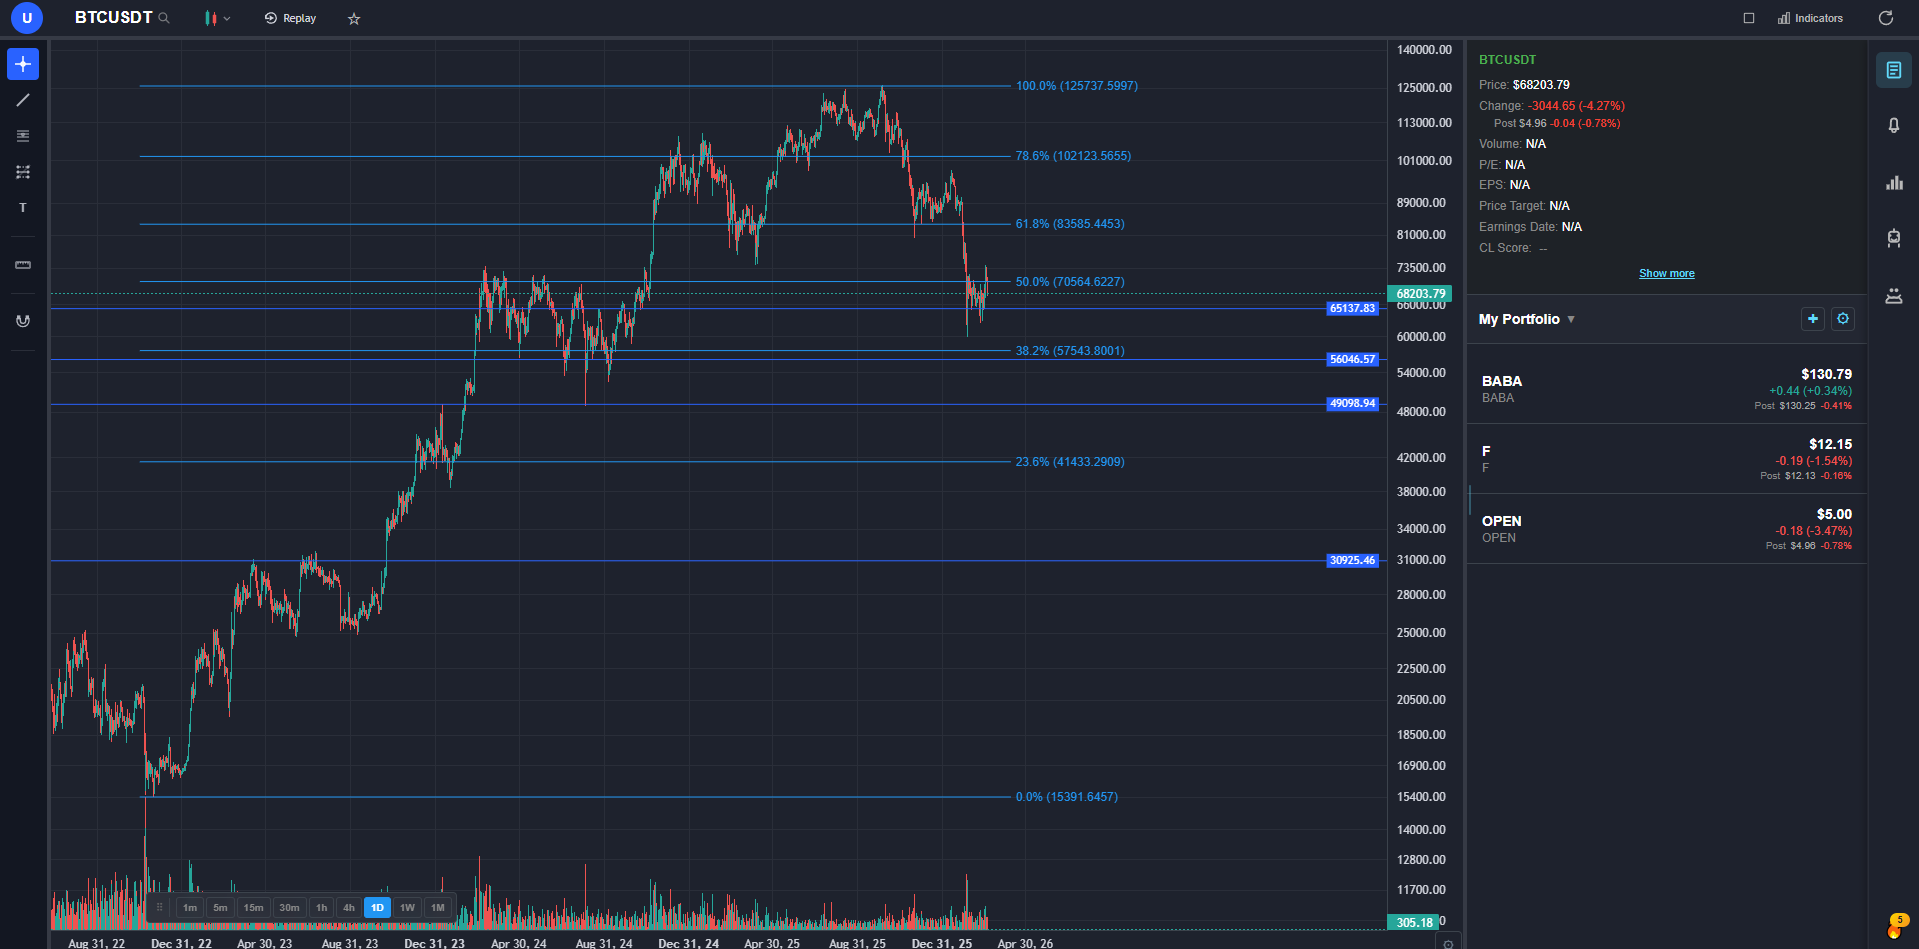
ChartingLens includes a fully featured fibonacci retracement tool on its free tier with no restrictions. You can draw fib levels on any stock or crypto chart by selecting the tool from the drawing toolbar and clicking from your chosen swing low to swing high (or the reverse for downtrends). The standard retracement levels (23.6%, 38.2%, 50%, 61.8%, 78.6%) are displayed by default, with clear labels and color-coded lines that make it easy to read levels at a glance.
What sets ChartingLens apart is that the fibonacci tool is part of a broader free drawing suite that includes trendlines, parallel channels, horizontal lines, and arrows. All drawings sync to the cloud, so your fib levels persist across devices and sessions. There is no limit on the number of fibonacci retracements you can draw per chart, and no paywall gating the feature behind a premium plan.
Pros
- Completely free fibonacci retracement tool
- Clean, labeled fib levels with color coding
- Cloud-synced drawings persist across sessions
- Part of a full free drawing toolkit
- No ads or feature gates
Cons
- No fibonacci extensions or fibonacci time zones yet
- Fewer fib tool variants than TradingView's paid tiers
TradingView
TradingView offers an extensive fibonacci toolkit that includes retracement, extension, fan, arc, time zone, and spiral tools. On the free tier, you can access the basic fibonacci retracement tool and draw it on your charts. The implementation is polished, with customizable level inputs and the ability to change colors for each ratio. However, the free tier limits you to one indicator per chart and one chart layout, which means you cannot pair your fib analysis with multiple technical indicators unless you upgrade. Paid plans start at $14.95 per month.
Thinkorswim (Schwab)
Thinkorswim includes fibonacci retracement as part of its drawing tools within the desktop application. The tool is functional and supports custom ratios. However, you need a Charles Schwab brokerage account to access the platform. The desktop interface can feel complex, and the fib tool implementation, while capable, lacks the modern feel of web-based alternatives. If you already have a Schwab account, it is a solid option. If you do not, there are easier ways to get free fibonacci retracement.
TrendSpider
TrendSpider takes fibonacci retracement further with automated fib level detection. The platform can algorithmically identify key swing points and draw fibonacci retracements for you, reducing the subjectivity that comes with manually selecting anchor points. This is a powerful feature for traders who want algorithmic precision. The catch: TrendSpider does not have a free tier. Plans start at $22 per month, making it one of the more expensive options for a feature that other platforms offer at no cost.
Auto Chart Pattern Recognition: Let Software Do the Work
Manually scanning charts for patterns is time-consuming. A head and shoulders forming on a daily chart. A bull flag on the 4-hour. A descending triangle on the 15-minute. Recognizing these patterns requires experience, attention to detail, and most critically, time. This is where auto chart pattern recognition tools and stock pattern recognition software come in: they scan charts programmatically and alert you when patterns form, so you do not have to stare at screens all day.
Automated pattern detection has evolved significantly. Early versions were simplistic and generated too many false positives. Modern implementations, powered by algorithms like those pioneered by TrendoScope, use sophisticated criteria to validate patterns, checking for volume confirmation, breakout proximity, and pattern symmetry before flagging a signal. Here is how the leading platforms handle auto chart pattern recognition.
ChartingLens
ChartingLens includes a free auto chart pattern recognition tool that detects 13+ chart patterns in real time. The detection engine uses TrendoScope-style algorithms to identify both classic and complex patterns, including head and shoulders, inverse head and shoulders, double tops, double bottoms, triple tops, triple bottoms, ascending triangles, descending triangles, symmetrical triangles, bull flags, bear flags, rising wedges, and falling wedges.
When the software detects a pattern, it overlays it directly on the chart with clearly drawn boundary lines showing the pattern structure. This visual feedback makes it easy to assess whether you agree with the detection and want to act on it. The feature runs on the free tier with no limitations, which is notable because most competing stock pattern recognition software requires a paid subscription.
Combined with ChartingLens's 40+ free indicators and AI-powered analysis tools, the pattern recognition feature gives traders a comprehensive setup scanner without spending anything. You can overlay detected patterns with RSI or MACD to add indicator confirmation, or use the platform's AI assistant to ask questions about a specific pattern's historical reliability.
Pros
- 13+ chart patterns detected automatically
- TrendoScope-style detection algorithms
- Visual pattern overlay on the chart
- Completely free, no subscription required
- Works alongside 40+ free indicators
Cons
- Pattern-based backtesting not yet integrated with auto-detection (manual strategy backtesting available)
- Detection tuning is automatic, not user-adjustable
TrendSpider
TrendSpider is perhaps the most well-known name in automated technical analysis. Its pattern recognition engine scans for classic patterns across multiple timeframes and can automatically draw trendlines, support and resistance levels, and fibonacci retracements. The platform also offers multi-timeframe analysis, automated alerts, and backtesting. The downside is the price: TrendSpider starts at $22 per month with no free tier. For traders committed to automation, it is a strong tool, but the cost puts it out of reach for those seeking free solutions.
TradingView
TradingView does not include a native auto chart pattern recognition feature. Instead, the community has built thousands of Pine Script indicators that attempt to detect various patterns. Some of these community scripts are quite good, particularly those maintained by popular authors with thousands of followers. However, the quality varies wildly, and you need to evaluate each script individually. On the free tier, you are limited to one indicator per chart, which means you cannot run a pattern recognition script alongside other indicators without upgrading. For traders who want reliable, built-in pattern detection, TradingView requires more manual curation than platforms with native tools.
Autochartist
Autochartist is a dedicated pattern recognition service that partners with brokers to deliver automated chart pattern analysis. It identifies patterns like triangles, channels, wedges, and head-and-shoulders formations, and estimates potential price targets based on historical pattern performance. Autochartist is typically available through broker partnerships rather than as a standalone product, which means access depends on your broker. Some brokers offer it for free to clients; others bundle it with premium accounts. It is not a charting platform in itself but rather a recognition layer that complements your existing tools.
Best Moving Average & Indicator Platforms
Moving averages are the workhorses of technical analysis. The 50-day simple moving average, the 200-day exponential moving average, the 20-period EMA on an intraday chart: these indicators help traders identify trend direction, dynamic support and resistance, and momentum shifts. But moving averages are just one piece of the puzzle. A complete indicator platform should also include oscillators like RSI and MACD, volatility measures like Bollinger Bands, and volume-based indicators. Here is how the best moving average indicator platforms compare.
ChartingLens
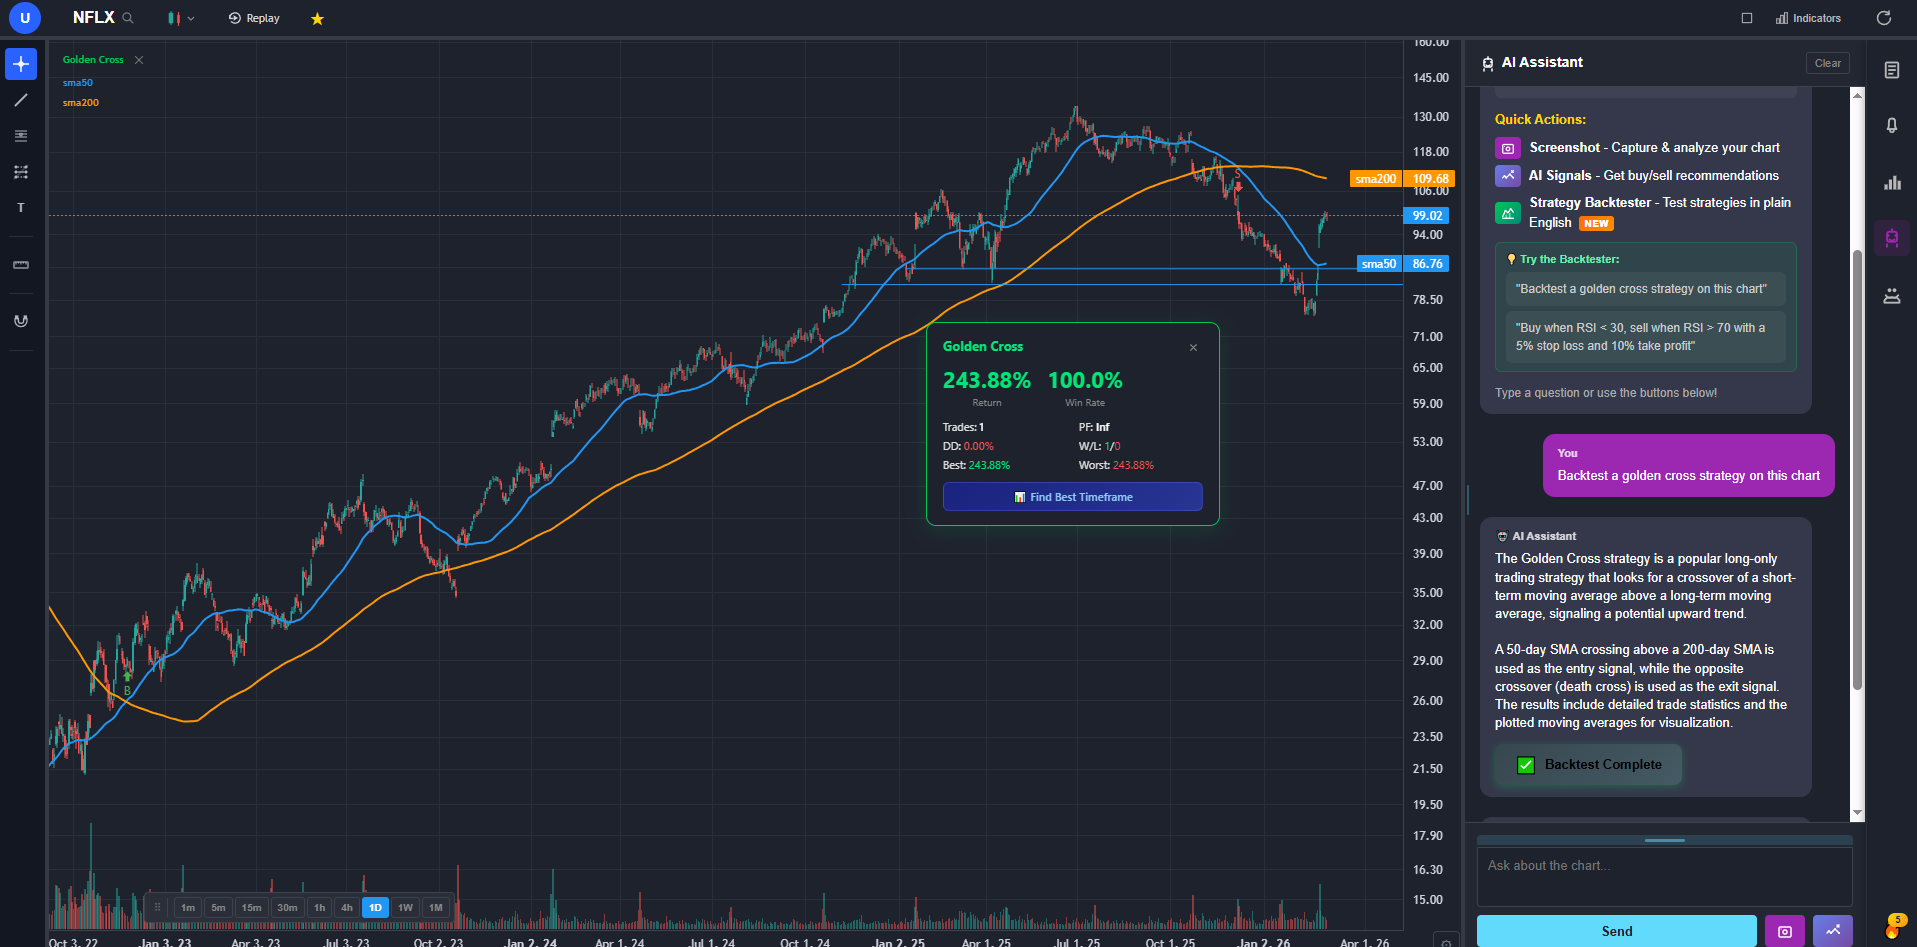
ChartingLens provides 40+ technical indicators on its free tier, including all the essentials that most traders need daily. The moving average suite covers Simple Moving Average (SMA), Exponential Moving Average (EMA), and Weighted Moving Average (WMA), each configurable to any period length. You can stack multiple moving averages on a single chart, which is critical for strategies like the golden cross (50 SMA crossing above 200 SMA) or using the 9/21 EMA combination for momentum trading.
Beyond moving averages, the platform includes RSI (Relative Strength Index), MACD (Moving Average Convergence Divergence), Bollinger Bands, Volume, VWAP (Volume Weighted Average Price), Stochastic Oscillator, ATR (Average True Range), OBV (On Balance Volume), Ichimoku Cloud, Parabolic SAR, Williams %R, CCI (Commodity Channel Index), and more. All of these are available on the free tier with no limits on how many you can apply to a single chart.
The indicator implementation is clean: each indicator renders with optimized defaults, clear legends, and the ability to adjust parameters. The fact that you can layer RSI, MACD, and two moving averages on the same chart at no cost is a meaningful advantage over platforms that restrict free users to a single indicator.
Pros
- 40+ indicators included free
- SMA, EMA, WMA with custom periods
- Stack unlimited indicators per chart
- RSI, MACD, Bollinger Bands, VWAP, Ichimoku, and more
- No paywall for any included indicator
Cons
- No custom scripting for building proprietary indicators
- Indicator library is curated rather than community-driven
TradingView
TradingView has arguably the largest indicator library in the world, thanks to its Pine Script language and active community. There are thousands of custom indicators available, from exotic moving average variants to complex multi-factor scoring systems. However, the free tier is severely limited: you can only apply 1 indicator per chart. This means if you want to see an EMA and RSI on the same chart, you need a paid plan. The Essential plan at $14.95 per month allows 2 indicators per chart, and you need the Plus plan at $29.95 per month for 5. For a platform that is the best moving average indicator platform in terms of breadth, the access restrictions on the free tier are a significant drawback.
Thinkorswim (Schwab)
Thinkorswim offers one of the deepest indicator libraries of any platform, with hundreds of built-in studies and the thinkScript language for building custom ones. Moving averages, oscillators, volume studies, breadth indicators, and more are all available at no extra cost once you have a Schwab account. The platform supports stacking as many indicators as your screen can handle. For sheer indicator power, Thinkorswim is hard to beat. The tradeoff is the steep learning curve and the requirement to maintain a brokerage account. If you are already a Schwab client, it is an exceptional resource. If you are not, the barrier to entry is higher than web-based alternatives.
Multi-Timeframe Charting Software
One of the most common mistakes new traders make is analyzing a stock on only one timeframe. A bullish engulfing candle on a 5-minute chart means very little if the stock is in a strong downtrend on the daily chart. Multi-timeframe charting software solves this problem by letting you view the same ticker across multiple intervals simultaneously, so you can confirm that your trade idea aligns with the broader trend before entering a position.
The concept is straightforward: you might have a daily chart on the left showing the primary trend, a 4-hour chart in the center to identify the intermediate structure, and a 15-minute chart on the right for precise entry timing. This "top-down" approach is used by professional traders worldwide, and the quality of your multi-timeframe charting software directly impacts how efficiently you can execute it.
Why Multi-Timeframe Analysis Matters
Consider a practical example. You spot a stock pulling back to the 61.8% fibonacci retracement level on the daily chart. That is a potentially strong support zone. But before entering the trade, you switch to the 1-hour chart and see that the pullback is accelerating with increasing volume, and the price has broken below a short-term trendline. On the 15-minute chart, there is no sign of a reversal yet. Without multi-timeframe analysis, you might have entered at the daily fib level and immediately been stopped out. With it, you would wait for the lower timeframes to confirm the reversal before committing capital.
ChartingLens
ChartingLens offers 1 chart on the free tier and up to 3 charts with 8 layout arrangements on Premium, allowing you to view the same stock across different timeframes or compare multiple stocks side by side. The layout system is intuitive: choose from side-by-side, stacked, asymmetric grids, and other configurations depending on your analysis style. Each chart in the layout operates independently, with its own timeframe, indicators, and drawing tools. Premium also includes multi-window support, letting you pop out independent chart windows for multi-monitor setups.
This means you can have a daily chart with fibonacci retracement levels, a 4-hour chart with moving averages and auto pattern recognition, and a 1-hour chart with RSI and MACD, all visible simultaneously in your preferred arrangement. Even on the free tier, you get a single full-featured chart with unlimited indicators and all drawing tools included.
Pros
- Up to 3 chart layouts with 8 arrangements on Premium
- Each chart has independent timeframe and indicators
- Flexible grid arrangements
- Combine with free drawing tools and pattern recognition
Cons
- Maximum of 4 layouts (power users may want more)
- No multi-monitor support
TradingView
TradingView is excellent for multi-timeframe analysis on its paid plans. The Plus plan ($29.95/month) offers 4 charts per layout, and the Premium plan ($59.95/month) offers 8 charts per layout. However, the free tier limits you to 1 chart layout, which makes true multi-timeframe analysis impossible without upgrading. If you are willing to pay, TradingView's multi-chart implementation is polished and feature-rich, with synced crosshairs and symbol linking across charts. But for free multi-timeframe charting, you will need to look elsewhere. Our TradingView alternatives guide covers the best options in detail.
Thinkorswim (Schwab)
Thinkorswim excels at multi-timeframe charting on the desktop application. You can open as many chart windows as your system can handle, each set to a different timeframe and loaded with different studies. The platform supports multiple monitors, making it a favorite among professional day traders who run multi-screen setups. There is no artificial limit on the number of charts. However, you need a Schwab brokerage account, and the desktop application is resource-intensive. The web version of Thinkorswim offers a more limited multi-chart experience.
Best Free Drawing Tools for Stock Charts
Now that we have examined each category individually, let us bring it all together. When evaluating the overall drawing tools for stock charts, you need to consider the full toolkit: trendlines, fibonacci retracement, channels, horizontal lines, annotations, and how these tools integrate with indicators and pattern recognition. Here is a comprehensive look at how the leading platforms compare as complete drawing tool suites.
ChartingLens: The Best Free All-Rounder
ChartingLens delivers the most complete free drawing experience among the platforms reviewed. The drawing toolbar includes trendlines, fibonacci retracement, parallel channels, horizontal lines, and arrows. All drawings are cloud-synced, meaning you can start a chart analysis on your desktop and continue on your laptop without losing a single line. The drawing tools work alongside 40+ free indicators, auto chart pattern recognition (13+ patterns), and up to 4 multi-timeframe chart layouts. For a platform that charges nothing for this level of functionality, ChartingLens sets the bar high.
The drawing tools themselves are responsive and precise. Trendlines snap to candle wicks for accuracy. Fibonacci retracement levels are clearly labeled with customizable display options. Parallel channels can be drawn quickly with a drag-and-drop interface. The absence of ads on any tier means your chart workspace is clean and distraction-free, which matters when you are focused on precise technical analysis.
TradingView: Most Drawing Tools, But at a Price
TradingView offers the widest selection of drawing tools of any charting platform. Beyond the basics, you get Gann fans, pitchforks, Elliott Wave tools, fibonacci extensions, arcs, spirals, and dozens of geometric shapes. For traders who need exotic drawing tools, TradingView is unmatched. The free tier does include access to most drawing tools, which is a positive. The limitation is on the indicator and layout side: you can draw freely, but you can only apply 1 indicator and view 1 chart at a time. If your workflow involves combining drawings with multiple indicators across multiple timeframes, TradingView's free tier will feel constraining.
Thinkorswim: Powerful but Complex
Thinkorswim provides a solid set of drawing tools within its desktop application, including trendlines, fibonacci retracement, channels, and text annotations. The tools are functional and reliable. However, the drawing interface on the desktop app can feel clunky compared to web-based platforms. Drawing a trendline on Thinkorswim takes more clicks than on ChartingLens or TradingView, and the visual styling options are more limited. If you are already using Thinkorswim for its indicator suite and options tools, the drawing tools are adequate. If drawing precision and speed are priorities, web-based alternatives may suit you better.
TrendSpider: Automated Drawing, Premium Price
TrendSpider approaches drawing tools differently. Instead of manual drawing, the platform algorithmically generates trendlines, support and resistance levels, and fibonacci retracements. This removes human subjectivity from the equation, which can be either a feature or a limitation depending on your style. The automated approach is useful for traders who want a second opinion on where key levels lie. But at $22 per month with no free tier, TrendSpider is positioned as a premium tool rather than a free alternative.