Why Technical Indicators Matter for Trading
Every trading decision comes down to a question: is this a good time to buy, sell, or stay on the sidelines? Technical indicators are the tools that help you answer that question with data instead of guesswork. They transform raw price and volume information into actionable signals, giving you a structured framework for analyzing any stock, cryptocurrency, or asset.
Whether you are a day trader scanning for intraday momentum shifts, a swing trader looking for multi-day setups, or a long-term investor timing entries into strong trends, technical indicators provide the edge that separates informed trading from gambling. The RSI indicator tells you when a stock is potentially overbought or oversold. The MACD indicator reveals momentum shifts before they become obvious on the price chart. Bollinger Bands show you when volatility is compressing and a breakout is imminent.
The challenge is not finding indicators. There are hundreds of them. The challenge is understanding which ones matter, how they work, when to use them, and how to combine them without creating a cluttered, contradictory mess on your chart. That is exactly what this guide covers. We will break down every major technical indicator that active traders use in 2026, explain the settings and strategies behind each one, and show you how to build a clean, effective indicator setup for your trading style.
What Are Technical Indicators?
Technical indicators are mathematical calculations based on a security's price, volume, or open interest. They are plotted on or alongside a price chart to help traders interpret market conditions, identify trends, gauge momentum, and anticipate potential reversals. Unlike fundamental analysis, which looks at a company's financials, technical analysis relies entirely on market-generated data.
Leading vs Lagging Indicators
One of the most important distinctions in technical analysis is between leading indicators and lagging indicators. Leading indicators attempt to predict future price movements. They give you signals before a trend change occurs, but they are also more prone to false signals. The RSI indicator and Stochastic oscillator are examples of leading indicators. Lagging indicators confirm trends after they have already started. They are more reliable but slower to signal. Moving averages and MACD are classic lagging indicators.
The best trading strategies use a combination of both types. A leading indicator might alert you to a potential reversal, and a lagging indicator confirms that the reversal is actually happening.
Four Categories of Technical Indicators
Every technical indicator falls into one of four broad categories, and understanding these categories is essential for building a balanced chart setup.
Identify the direction of the market. Examples: moving averages (EMA, SMA), MACD, Supertrend indicator, Ichimoku Cloud.
Measure the speed and strength of price movements. Examples: RSI indicator, Stochastic oscillator, MACD histogram.
Show how much price is fluctuating. Examples: Bollinger Bands, ATR indicator (Average True Range), Keltner Channels.
Analyze trading volume to confirm trends and spot divergences. Examples: VWAP indicator, Volume Profile, On-Balance Volume (OBV).
The key principle is to avoid stacking indicators from the same category. Using RSI and Stochastic together, for instance, gives you two momentum readings that will usually agree, adding noise without new information. Instead, pick one indicator from each category to get a well-rounded view of the market.
RSI (Relative Strength Index) Explained
The RSI indicator is arguably the single most popular momentum oscillator in all of technical analysis. Developed by J. Welles Wilder in 1978, the Relative Strength Index measures the speed and magnitude of recent price changes to evaluate whether a stock is overbought or oversold. It oscillates between 0 and 100, with readings above 70 traditionally considered overbought and readings below 30 considered oversold.
How the RSI Indicator Works
RSI calculates the ratio of average gains to average losses over a specified period (typically 14 periods). When a stock has been rising consistently, the RSI moves higher. When it has been falling, the RSI moves lower. The formula normalizes this ratio to a scale of 0 to 100, making it easy to compare RSI readings across different stocks and timeframes.
Here is how to use RSI in practice:
- Overbought signal (RSI above 70): The stock has risen aggressively and may be due for a pullback or consolidation. This does not mean you should immediately sell. In a strong uptrend, RSI can stay above 70 for extended periods. Think of it as a caution flag, not an automatic sell signal.
- Oversold signal (RSI below 30): The stock has fallen sharply and may be due for a bounce. Again, in a strong downtrend, RSI can stay below 30 for a long time. Use oversold readings as a reason to watch more closely, not as a blind buy signal.
- Centerline crossover (RSI crossing 50): When RSI crosses above 50, it suggests bullish momentum is building. When it crosses below 50, bearish momentum is gaining strength. Many traders use the 50 level as a trend filter.
RSI Divergences
RSI divergences are among the most powerful signals in technical analysis. A bullish divergence occurs when price makes a lower low but RSI makes a higher low. This suggests that selling momentum is weakening even as price continues to drop, often foreshadowing a reversal upward. A bearish divergence occurs when price makes a higher high but RSI makes a lower high, signaling that buying momentum is fading despite rising prices.
Divergences work best when they appear at extreme RSI levels (above 70 or below 30) and are confirmed by other indicators or price action patterns such as candlestick reversals or support and resistance levels.
Best RSI Settings for Day Trading
The default RSI period of 14 is the most widely used and works well across most timeframes. However, adjusting the period can optimize RSI for your specific trading style.
- RSI 7 or 9: Faster response, more signals, more noise. Best for scalpers and day traders using 1-minute to 15-minute charts who want to use RSI for quick momentum reads.
- RSI 14 (default): The industry standard. Balanced between sensitivity and reliability. Works well for day trading, swing trading, and positional trading.
- RSI 21 or 25: Smoother, fewer signals, less noise. Best for swing traders and position traders who want to filter out short-term fluctuations and focus on meaningful momentum shifts.
MACD Indicator: The Complete Breakdown
The MACD indicator (Moving Average Convergence Divergence) is one of the most trusted trend-following momentum indicators in trading. Created by Gerald Appel in the late 1970s, MACD shows the relationship between two exponential moving averages of a security's price. When people ask "what is the MACD indicator," the simplest answer is: it is a tool that reveals both the direction of a trend and its momentum in a single visual.
How MACD Works
MACD explained in its simplest form: the indicator consists of three components:
- MACD Line: The difference between the 12-period EMA and the 26-period EMA. When the faster EMA (12) is above the slower EMA (26), the MACD line is positive, indicating bullish momentum. When it is below, the MACD line is negative, indicating bearish momentum.
- Signal Line: A 9-period EMA of the MACD line itself. This acts as a trigger for buy and sell signals. When the MACD line crosses above the signal line, it generates a bullish signal. When it crosses below, it generates a bearish signal.
- Histogram: The difference between the MACD line and the signal line, displayed as a bar chart. The histogram makes it easy to visualize momentum changes. Growing bars indicate accelerating momentum; shrinking bars indicate decelerating momentum.
MACD Signal Line Crossovers
The most basic MACD trading strategy is the signal line crossover. A bullish crossover occurs when the MACD line crosses above the signal line, suggesting that short-term momentum is turning positive. A bearish crossover occurs when the MACD line crosses below the signal line. These crossovers are especially significant when they happen near the zero line or at extreme levels, as they carry more weight in those contexts.
MACD Divergence
Like RSI, the MACD indicator can produce divergence signals. When price makes a new high but the MACD makes a lower high, it is a bearish divergence that warns of a potential trend reversal. When price makes a new low but the MACD makes a higher low, it is a bullish divergence suggesting the downtrend may be losing steam. MACD divergence combined with RSI divergence at the same time creates one of the highest-probability reversal signals in technical analysis.
MACD Settings Explained
The standard MACD settings are (12, 26, 9), meaning a 12-period fast EMA, a 26-period slow EMA, and a 9-period signal line. These default settings work well for most traders and timeframes. However, you can adjust them:
- (8, 17, 9): Faster settings for day trading. More responsive to short-term price changes, producing earlier signals but more whipsaws.
- (12, 26, 9): The default. Balanced for swing trading and daily charts. This is what most MACD tutorials refer to when they teach the indicator.
- (24, 52, 9): Slower settings for position traders and weekly charts. Filters out noise and only signals significant trend changes.
Bollinger Bands: Volatility and Breakouts
Bollinger Bands are one of the most visually intuitive technical indicators on any chart. Created by John Bollinger in the 1980s, Bollinger Bands consist of three lines that form an envelope around price, dynamically adjusting to market volatility. They are a volatility indicator at their core, but traders use them for everything from identifying overbought and oversold conditions to spotting breakout setups.
How Bollinger Bands Work
The three components of Bollinger Bands are:
- Middle Band: A 20-period simple moving average (SMA) of the closing price. This serves as the baseline trend.
- Upper Band: The middle band plus 2 standard deviations. Price touching or exceeding the upper band suggests the asset is trading at a relatively high price compared to recent history.
- Lower Band: The middle band minus 2 standard deviations. Price touching or exceeding the lower band suggests the asset is trading at a relatively low price.
The key insight behind Bollinger Bands is that approximately 95% of price action occurs within the bands (assuming a normal distribution). When price moves outside the bands, it represents a statistically significant event that warrants attention.
The Bollinger Band Squeeze
One of the most powerful Bollinger Bands signals is the squeeze. A squeeze occurs when the bands contract tightly together, indicating that volatility has compressed to an unusually low level. Low volatility periods are typically followed by high volatility periods, so a Bollinger Band squeeze often precedes a significant price breakout. The direction of the breakout is not guaranteed by the squeeze itself, which is why traders combine Bollinger Bands with momentum indicators like RSI or MACD to gauge the likely breakout direction.
Bollinger Bands Breakout Strategies
There are two primary ways to trade Bollinger Bands:
- Mean reversion (bounce trading): When price touches the lower Bollinger Band and RSI is below 30, some traders buy expecting a reversion back to the middle band. Similarly, when price touches the upper band with RSI above 70, they sell or short. This works best in ranging, sideways markets.
- Breakout trading: When price closes above the upper Bollinger Band on strong volume after a squeeze, traders go long expecting continued momentum. When price closes below the lower band after a squeeze, they go short. This works best when the squeeze has been prolonged and volume confirms the breakout.
The standard Bollinger Bands settings are a 20-period SMA with 2 standard deviations. These defaults work well for most applications.
- Tighter bands (1.5 standard deviations): More sensitive, price touches the bands more frequently. Useful for mean reversion strategies in low-volatility environments.
- Wider bands (2.5 standard deviations): Less sensitive, only extreme moves reach the bands. Useful for identifying truly exceptional price moves.
- Shorter period (10): Faster-moving bands for day trading on intraday charts.
Moving Averages Deep Dive: EMA vs SMA
Moving averages are the foundation of trend analysis and among the best technical indicators for day trading. They smooth out price data to create a single flowing line that makes it easier to identify the direction of the trend. The two most important types are the Simple Moving Average (SMA) and the Exponential Moving Average (EMA), and the EMA vs SMA debate is one of the most common discussions in trading education.
SMA (Simple Moving Average)
The SMA calculates the arithmetic mean of a set number of past closing prices. A 50-period SMA adds up the last 50 closing prices and divides by 50. Every data point in the calculation carries equal weight. This makes the SMA smooth and steady, but also slower to react to recent price changes. The most widely watched SMAs are the 50-period and 200-period, which form the basis of golden cross and death cross signals.
EMA (Exponential Moving Average)
The EMA gives more weight to recent price data, making it react faster to current market conditions. This responsiveness makes the EMA popular among day traders who need their indicators to keep pace with fast-moving intraday price action. The most popular EMAs for day trading are the 9-period, 20-period, and 21-period EMAs.
EMA vs SMA: Which Should You Use?
The EMA vs SMA decision depends entirely on your trading timeframe and style:
- Day trading: EMAs are generally preferred because they react faster. The 9 EMA and 21 EMA are the most popular for day trading. A 9 EMA crossing above a 21 EMA on a 5-minute chart is a classic intraday buy signal.
- Swing trading: Both work well. Many swing traders use a combination, such as the 20 EMA for entries and the 50 SMA for trend direction.
- Position trading and investing: SMAs are preferred for their smoothness. The 50 SMA and 200 SMA are institutional benchmarks. Many portfolio managers use the 200 SMA as a filter: they only buy stocks trading above it.
Golden Cross and Death Cross
The golden cross occurs when the 50-period moving average crosses above the 200-period moving average. It is widely regarded as a bullish signal indicating that a new uptrend may be forming. The death cross is the opposite: the 50-period crossing below the 200-period, signaling a potential bear market or extended downtrend. These signals are lagging by nature, so they work best as confirmation tools rather than precise entry signals. Many traders use the golden cross to confirm that it is safe to be long, and the death cross to move to the sidelines or get defensive.
VWAP Indicator for Day Trading
The VWAP indicator (Volume Weighted Average Price) is the single most important indicator for many professional day traders and institutional traders. Unlike a simple moving average that only looks at price, VWAP factors in both price and volume, giving you the true average price at which a stock has been trading throughout the day. It is essentially the benchmark that institutional traders use to evaluate whether they got a good execution price on their orders.
What VWAP Is and How It Works
VWAP is calculated by taking the cumulative total of price multiplied by volume, divided by the cumulative total volume. It resets at the beginning of each trading session, which is why it is primarily a day trading tool. The resulting line on your chart represents the volume-weighted average price from the market open to the current time.
Here is what makes the VWAP indicator so valuable: because institutional traders (who move the most volume) use VWAP as their benchmark, price tends to gravitate toward VWAP throughout the day. This makes VWAP a natural support and resistance level, not because of some magical property, but because real institutional money is buying and selling relative to it.
How Day Traders Use VWAP
- Trend filter: When price is above VWAP, the intraday trend is considered bullish. When price is below VWAP, the trend is bearish. Many day traders will only take long trades when price is above VWAP and short trades when price is below.
- Pullback entries: In an uptrend, price will often pull back to VWAP before bouncing. Buying these pullbacks to VWAP gives you an entry at the average institutional price, which tends to be a strong support level.
- VWAP crossover: When price crosses above VWAP on strong volume, it can signal the start of an intraday uptrend. When it crosses below, it can signal a downtrend.
Anchored VWAP
While standard VWAP resets daily, anchored VWAP lets you anchor the calculation to any starting point: an earnings release, a breakout level, a swing low, or any other significant event. This extends VWAP's usefulness beyond just day trading. Swing traders use anchored VWAP from a stock's 52-week low or from a major gap to identify institutional cost basis levels that may act as long-term support or resistance.
VWAP vs Moving Averages
The key difference between VWAP and a moving average is that VWAP accounts for volume. A simple or exponential moving average treats every candle equally, regardless of whether 100 shares or 10 million shares traded at that price. VWAP weights its calculation by volume, so prices where heavy institutional trading occurred have more influence on the line. For day trading, this makes VWAP a more accurate representation of where the "real" average price is. Moving averages are better for multi-day trend analysis, while the VWAP indicator excels for intraday price context.
More Essential Indicators
Beyond the core trio of RSI, MACD, and Bollinger Bands, several other indicators are widely used by active traders. Here is a thorough look at each one and when to use it.
Stochastic Oscillator
The Stochastic oscillator compares a stock's closing price to its price range over a given period (typically 14 periods). It produces two lines: %K (the fast line) and %D (the slow line, which is a 3-period SMA of %K). Like RSI, it oscillates between 0 and 100, with readings above 80 considered overbought and below 20 considered oversold.
The Stochastic oscillator differs from RSI in that it is more sensitive to short-term price changes and generates more frequent signals. This makes it popular among day traders and scalpers who want quick momentum reads. The most actionable signal is when %K crosses %D in overbought or oversold territory. A %K crossover above %D below the 20 level is a bullish signal; a %K crossover below %D above the 80 level is bearish.
ATR Indicator (Average True Range)
The ATR indicator measures market volatility by calculating the average range of price movement over a specified period (typically 14). Unlike Bollinger Bands, which are plotted on the price chart, ATR is displayed as a separate oscillator. A higher ATR reading means the stock is more volatile; a lower reading means it is calmer.
The Average True Range is not a directional indicator. It does not tell you whether price will go up or down. Instead, it tells you how much price is likely to move, which is invaluable for setting stop losses and profit targets. If a stock has an ATR of $2.50 on the daily chart, placing a stop loss $0.50 away is likely too tight and will get hit by normal volatility. A stop at 1.5x ATR ($3.75) gives the trade room to breathe while still protecting against a significant move against you.
Supertrend Indicator
The Supertrend indicator is a trend-following overlay that plots directly on the price chart, changing color based on the trend direction. It uses ATR (Average True Range) in its calculation, making it both a trend and volatility-aware indicator. When the Supertrend line is below price and green, the trend is bullish. When it is above price and red, the trend is bearish.
The Supertrend indicator is popular for its simplicity. It provides clear, unambiguous buy and sell signals: go long when the Supertrend turns green (flips below price) and go short or exit when it turns red (flips above price). The default settings use a 10-period ATR with a multiplier of 3. A lower multiplier makes the Supertrend more sensitive and closer to price; a higher multiplier makes it smoother and further from price.
Volume Profile
Volume Profile is fundamentally different from traditional volume bars that appear at the bottom of your chart. Instead of showing volume over time (how much was traded during each candle), Volume Profile shows volume at price (how much was traded at each price level). It creates a horizontal histogram alongside the price chart, revealing where the most and least trading activity occurred.
The two most important levels on a Volume Profile are the Point of Control (POC), which is the price level with the highest traded volume, and the Value Area, which is the range containing 70% of all volume. The POC acts as a magnet for price, making it a powerful support and resistance level. High volume nodes (HVNs) indicate areas of price acceptance where the market found fair value. Low volume nodes (LVNs) indicate price rejection areas where the market moved through quickly, often acting as support and resistance levels because price tends to move rapidly through these zones.
Ichimoku Cloud
The Ichimoku Cloud is a comprehensive indicator system developed in Japan that provides information about trend direction, momentum, support and resistance, and potential reversal points, all in a single glance. It consists of five lines: Tenkan-sen (conversion line), Kijun-sen (base line), Senkou Span A (leading span A), Senkou Span B (leading span B), and Chikou Span (lagging span). The area between Senkou Span A and B forms the "cloud" (Kumo).
The Ichimoku Cloud can look intimidating at first, but its core interpretation is straightforward. When price is above the cloud, the trend is bullish. When price is below the cloud, the trend is bearish. When price is inside the cloud, the market is in a transition or consolidation zone. The cloud itself acts as dynamic support and resistance. A thick cloud indicates strong support or resistance; a thin cloud indicates a weak barrier that price can break through easily.
How to Combine Indicators Effectively
The biggest mistake traders make with technical indicators is using too many of the same type. Adding RSI, Stochastic oscillator, and CCI to a chart gives you three momentum readings that will almost always tell you the same thing. Your chart becomes cluttered, your analysis becomes paralyzed, and you end up with conflicting signals that erode your confidence in any given trade.
The Rule of Complementary Indicators
The most effective indicator setups combine one indicator from each of the four categories: trend, momentum, volatility, and volume. This gives you a complete view of the market without redundancy. Here is an example of a clean, powerful setup:
- Trend: 20 EMA (identifies the direction of the prevailing trend)
- Momentum: RSI 14 (identifies overbought/oversold conditions and divergences)
- Volatility: Bollinger Bands (identifies squeeze setups and volatility expansion)
- Volume: VWAP (identifies institutional price levels and confirms trend direction)
RSI + MACD + Bollinger Bands Strategy
One of the most popular multi-indicator strategies combines RSI, MACD, and Bollinger Bands. Here is how it works as a complete system:
- Identify a Bollinger Band squeeze: Wait for the Bollinger Bands to contract to a narrow range, indicating that a breakout is imminent.
- Check MACD for direction: If the MACD is above the signal line and the histogram is growing, the likely breakout direction is upward. If the MACD is below the signal line with a declining histogram, the likely direction is downward.
- Confirm with RSI: For a bullish setup, RSI should be above 50 (confirming bullish momentum) but below 70 (confirming the move is not already overextended). For a bearish setup, RSI should be below 50 but above 30.
- Enter on the breakout: When price breaks above the upper Bollinger Band on increased volume with MACD bullish and RSI confirming, enter long. Place your stop loss below the lower Bollinger Band or at 1.5x ATR below your entry.
- Exit signals: Exit when RSI reaches overbought territory (above 70), when MACD gives a bearish crossover, or when price returns inside the Bollinger Bands after an extended move outside.
This RSI + MACD + Bollinger Bands combination works because each indicator contributes a unique piece of information: Bollinger Bands identify the setup (volatility compression), MACD identifies the direction (trend momentum), and RSI confirms the timing (momentum not overextended). ChartingLens lets you overlay all three for free on a single chart with no indicator limits.
Avoiding Indicator Overload
As a general rule, limit your chart to three or four indicators maximum. More than that and you are likely either duplicating information or creating so many conditions that no trade ever meets all your criteria. Remember: the goal of indicators is to increase your confidence in a trade decision, not to achieve certainty. Certainty does not exist in markets.
Best Technical Indicators for Day Trading
If you are specifically looking for the best technical indicators for day trading, here is a ranked list based on how essential each indicator is for intraday analysis, how frequently professional day traders use them, and how actionable their signals are on short timeframes. For a complete breakdown of intraday setups and risk management, see our day trading strategies guide.
1. VWAP (Volume Weighted Average Price)
The VWAP indicator is the number one tool for day traders. It provides the institutional benchmark price for the day, acts as dynamic support and resistance, and serves as a trend filter. Essential for every day trader.
2. EMA (9 and 21 Exponential Moving Averages)
The 9 EMA and 21 EMA combination is the most popular moving average setup for day trading. EMA crossovers generate quick entry signals, and the EMAs act as dynamic intraday support and resistance. Better than SMA for intraday speed. This is where the EMA vs SMA debate is clearest: for day trading, EMA wins.
3. RSI (Relative Strength Index, 9 or 14 Period)
The RSI indicator identifies overbought and oversold conditions on intraday charts, helping you avoid buying into overextended moves. RSI divergences on 5-minute or 15-minute charts are powerful reversal signals. Best momentum oscillator for day trading.
4. MACD (12, 26, 9)
The MACD indicator confirms trend direction and momentum shifts. While it is slightly lagging, the MACD histogram provides early warning of momentum changes that the crossover eventually confirms. Best for confirming intraday trend changes.
5. Bollinger Bands (20, 2)
Bollinger Bands identify volatility squeezes and breakout opportunities during the trading day. The squeeze setup on a 5-minute or 15-minute chart can generate explosive intraday moves. Best volatility indicator for day trading.
6. Volume Profile
Volume Profile reveals key support and resistance levels based on where the most trading activity occurred. The Point of Control and Value Area from the prior session provide high-probability levels to trade around. Essential for understanding market structure.
7. ATR (Average True Range)
The ATR indicator does not generate trade signals directly, but it is critical for setting proper stop losses and position sizes based on current volatility. Essential for risk management.
8. Supertrend Indicator
The Supertrend indicator provides clear, visual trend direction signals directly on the chart. It is especially useful for traders who want simple, unambiguous signals without interpreting oscillators. Best for trend-following day trading systems.
9. Stochastic Oscillator
The Stochastic oscillator is more sensitive than RSI and generates faster signals on intraday charts. It is best used in range-bound conditions or as a confirmation alongside trend indicators. Best for scalping in range-bound markets.
10. Ichimoku Cloud
The Ichimoku Cloud provides a comprehensive trend overview on intraday charts, though it works best on 15-minute charts and above. It is less popular for pure day trading but valuable for traders who want a single indicator that captures trend, support, and momentum. Best for comprehensive intraday trend analysis.
Best Platforms for Technical Indicators in 2026
Having the right indicators is only half the equation. You also need a platform that makes it easy to apply, customize, and combine them. Here is how the top platforms stack up for technical indicator users in 2026.
1. ChartingLens
ChartingLens is the best platform for traders who want access to all the indicators discussed in this guide without paying for them. The free tier includes 40+ technical indicators (RSI, MACD, Bollinger Bands, EMA, SMA, VWAP, Stochastic, ATR, Supertrend, Volume Profile, and more) with no per-chart indicator limit. You can stack as many indicators as you need on a single chart, which is essential for multi-indicator strategies like the RSI + MACD + Bollinger Bands setup described above.
What sets ChartingLens apart from every other platform is its AI integration. The AI buy/sell signals use RSI, MACD, Bollinger Bands, and other indicators under the hood, analyzing them across thousands of stocks to surface high-probability setups automatically. Instead of manually scanning charts for Bollinger Band squeezes with bullish MACD crossovers and confirming RSI, the AI does this work for you and alerts you when setups appear. The AI trading assistant can also explain any indicator on your chart, making it an ideal learning tool for traders who are still mastering how to use RSI, MACD, or any other indicator.
The platform is web-based, loads quickly, has no ads on any tier, and the premium plan at $14.99 per month is the most affordable upgrade option among all serious charting platforms.
Pros
- 40+ indicators free, no per-chart limit
- AI signals use RSI/MACD/Bollinger Bands automatically
- AI assistant explains any indicator on your chart
- No ads, fast, browser-based
- $14.99/mo premium is the lowest in the industry
- Insider trading data and hedge fund holdings included
Cons
- Smaller community than TradingView
- No custom scripting language yet
- No built-in brokerage
2. TradingView


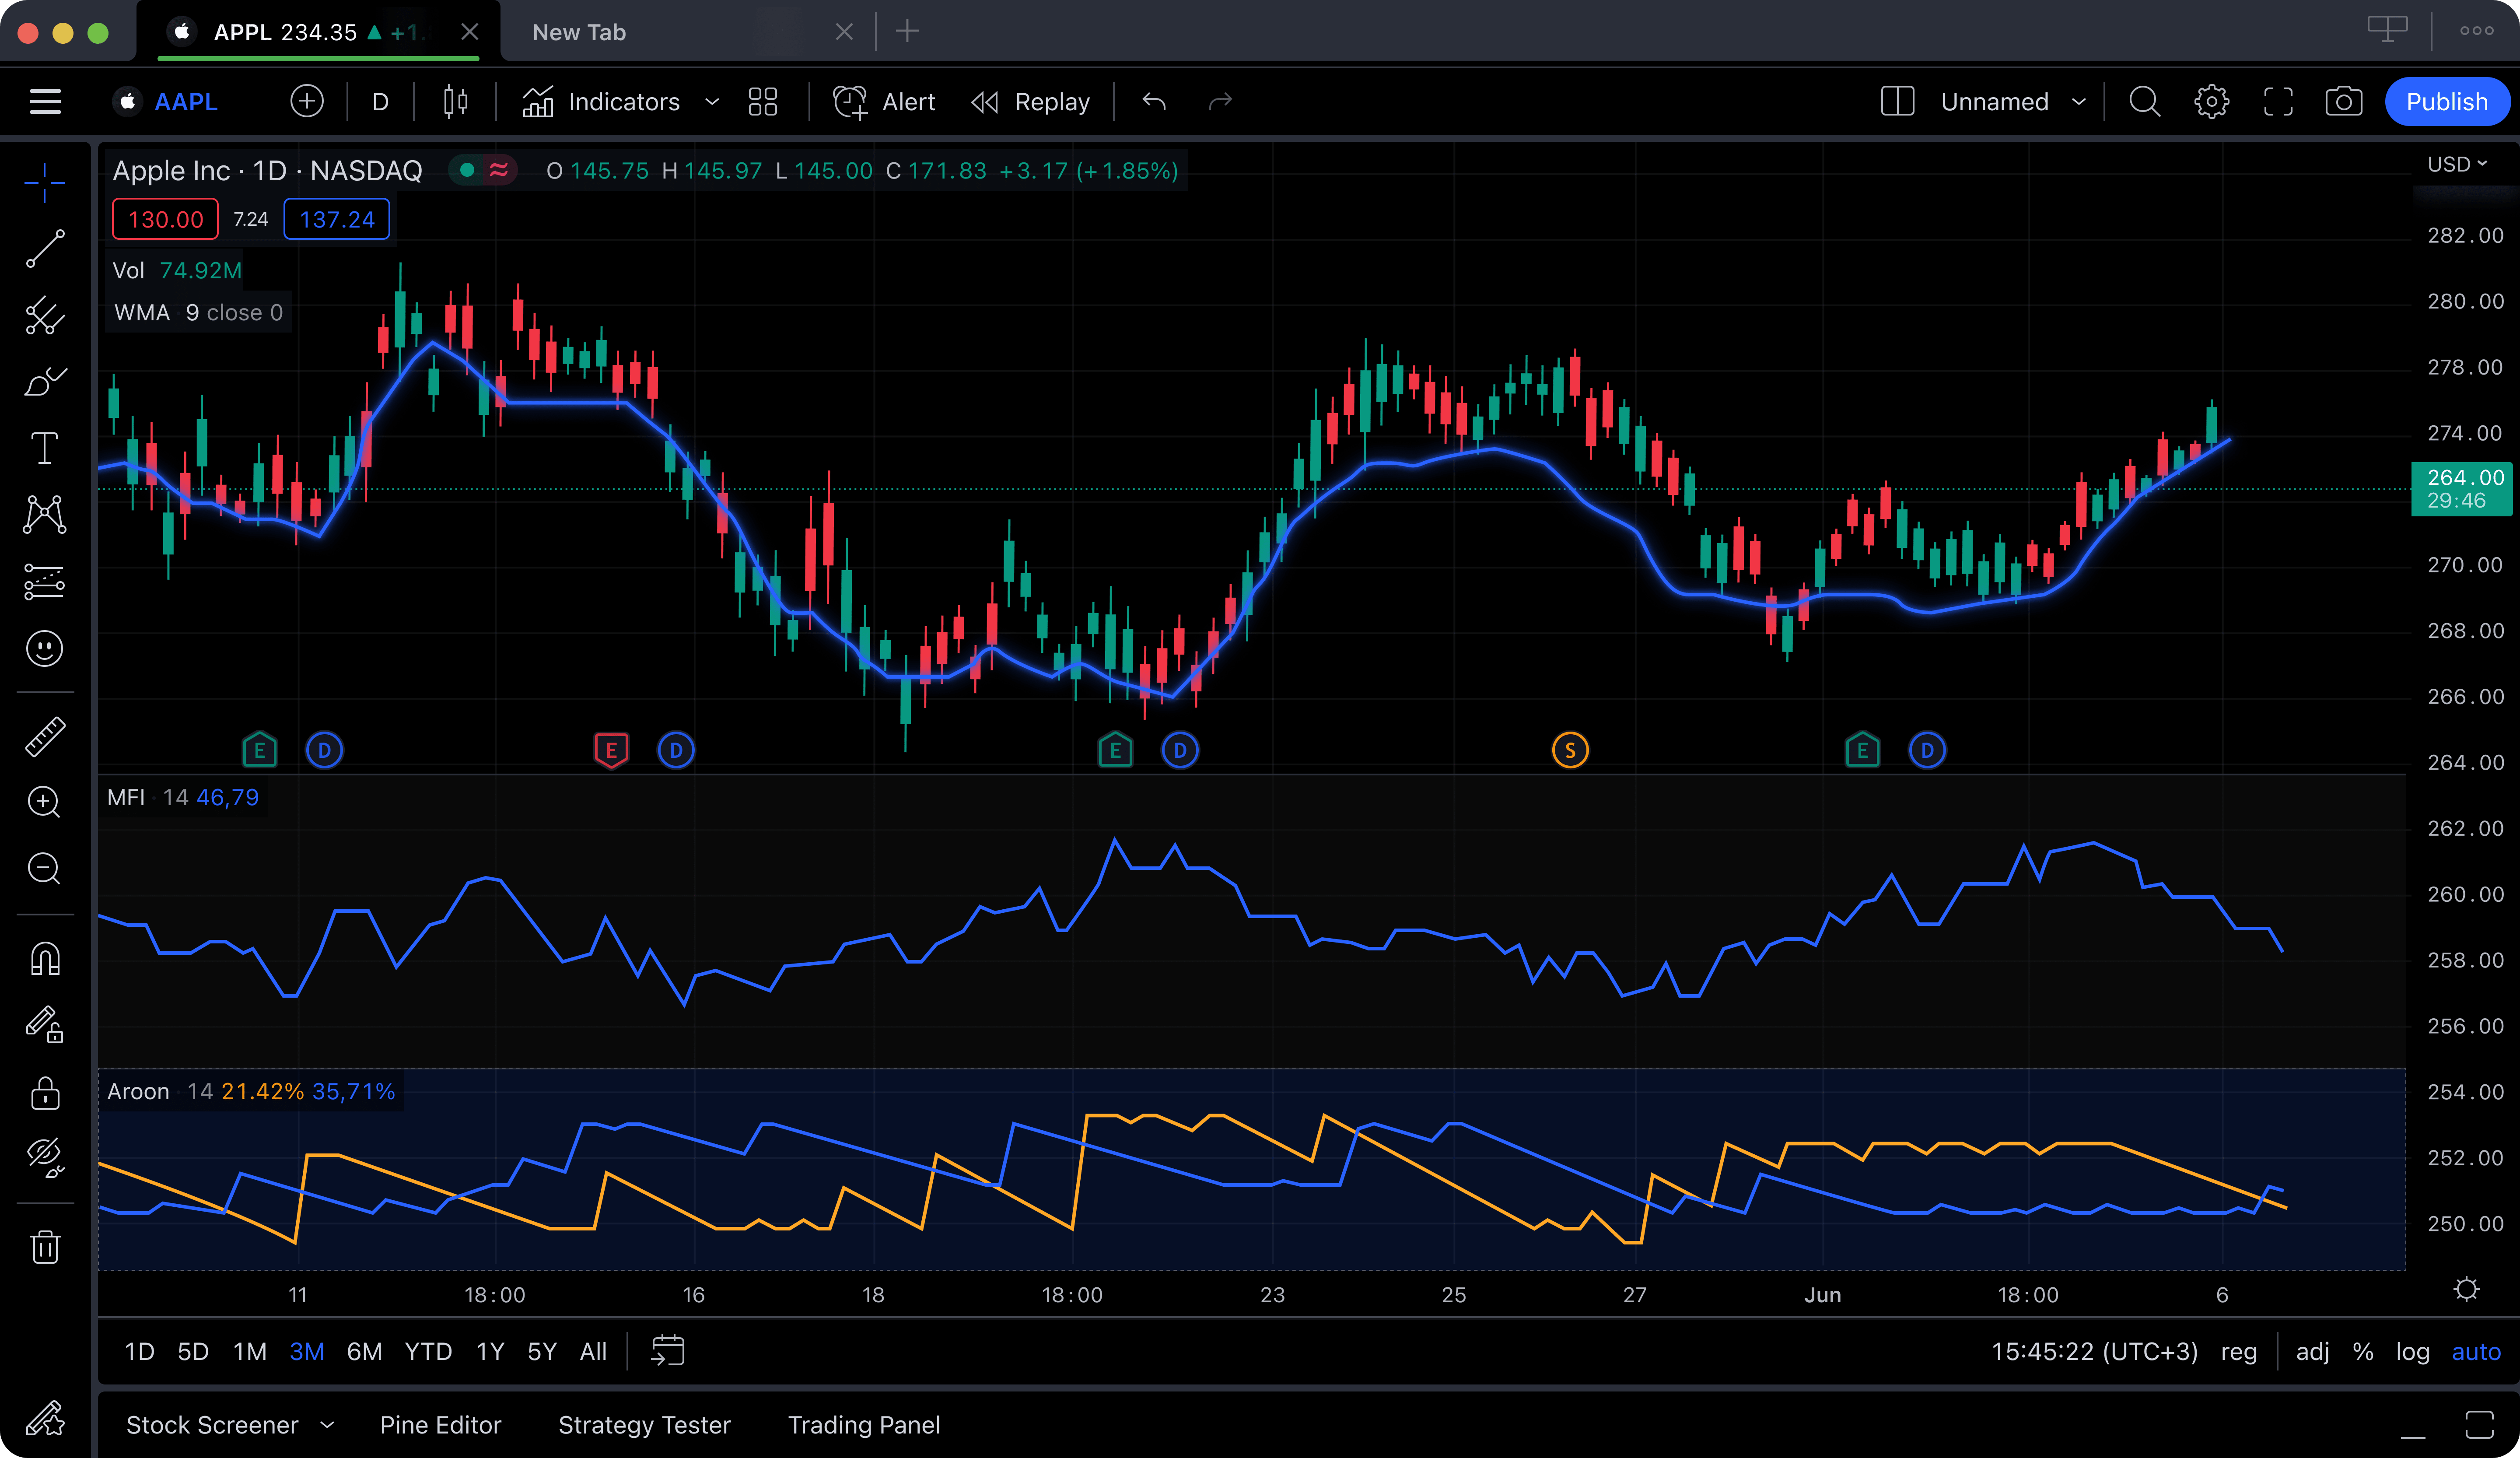
TradingView has the largest library of indicators in the industry, thanks in large part to its Pine Script ecosystem where community members create and share custom indicators. If you want an obscure or niche indicator, chances are someone has already built it on TradingView.
The limitation is the free tier: you can only apply 1 indicator per chart. Since any serious technical analysis setup requires at least 2-3 indicators (and the best strategies use 4+), free users are immediately hamstrung. You cannot run RSI and MACD and Bollinger Bands on the same chart without upgrading. The Essential plan at $14.95 per month allows 2 indicators per chart, and you need the Plus plan at $29.95 per month for 5 indicators per chart. Compare this to ChartingLens, which gives you unlimited indicators for free.
Pros
- Massive indicator library with Pine Script
- Large social trading community
- Covers stocks, crypto, forex, futures
Cons
- Free tier: only 1 indicator per chart
- Paid plans are expensive ($14.95 to $59.95/mo)
- Ads on the free plan
- No AI analysis or signals
3. Thinkorswim (Schwab)
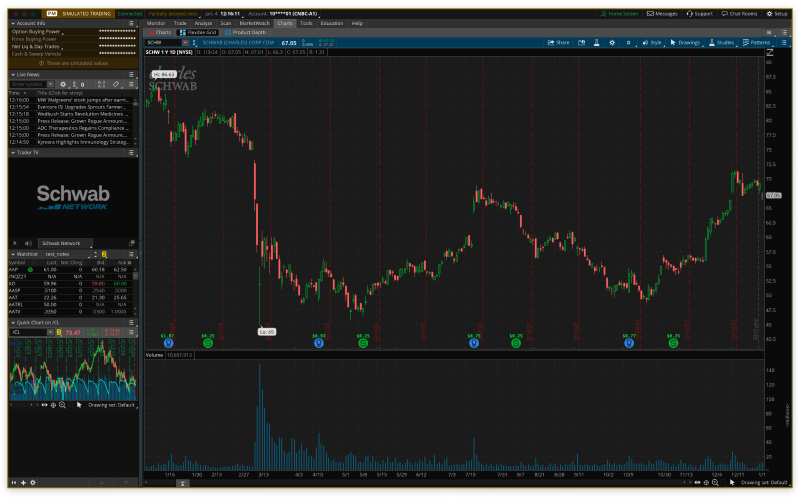
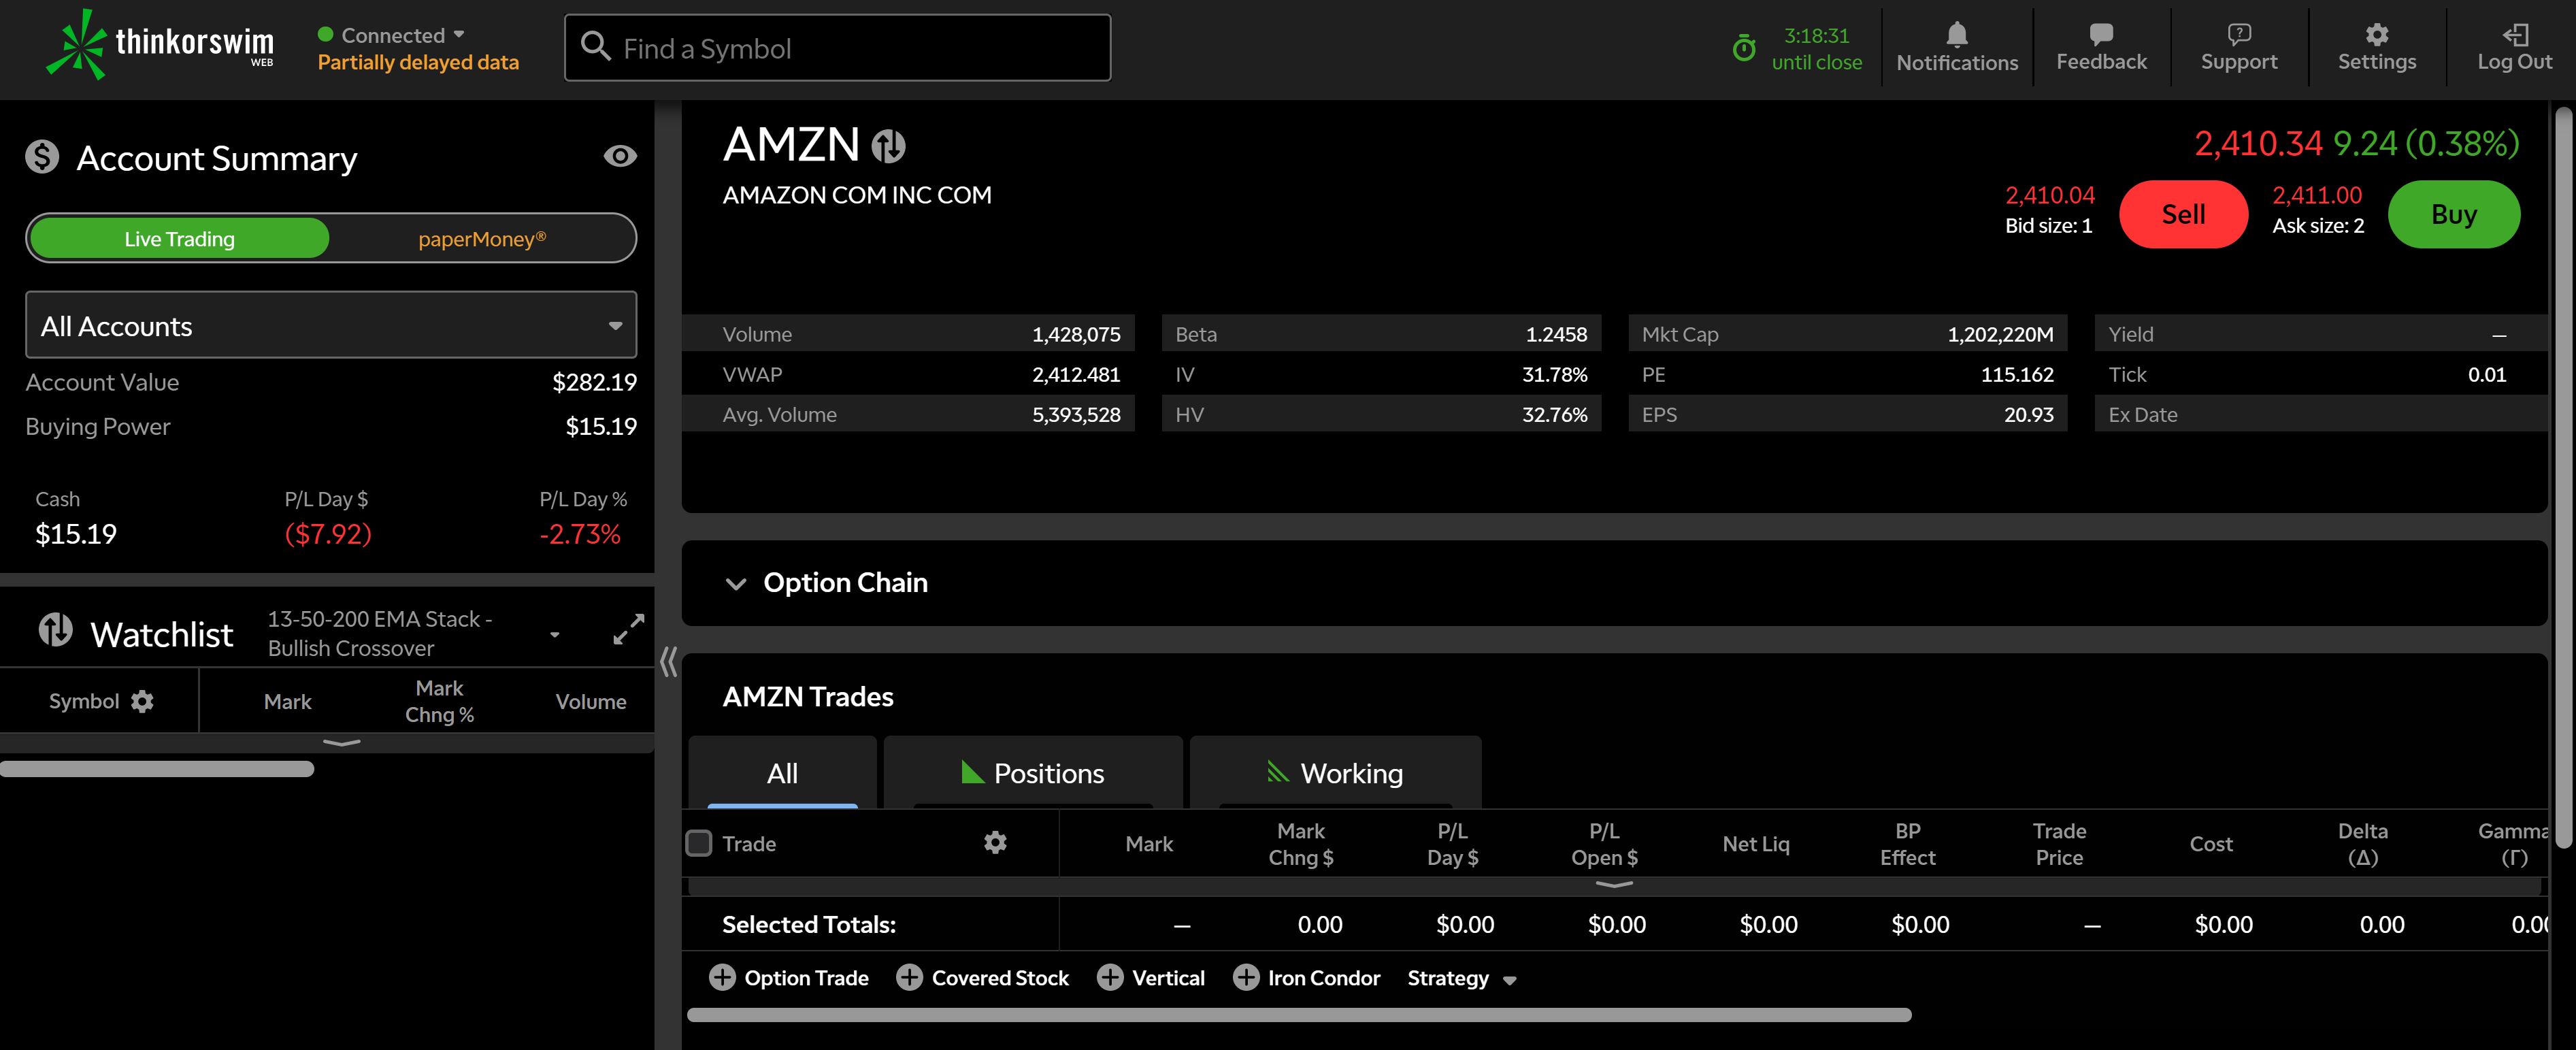
Thinkorswim offers over 400 technical studies, making it one of the most indicator-rich platforms available. It supports all the indicators covered in this guide, plus many advanced options-specific studies. The desktop application allows extensive customization of indicator settings and the ability to write custom studies in thinkScript.
The trade-off is complexity. Thinkorswim's interface was designed for professionals, and it shows. New traders often struggle with the learning curve. You also need to open a Schwab brokerage account to access the platform, which may not be ideal if you just want a charting tool. There are no AI features, and the platform can feel sluggish on older hardware.
Pros
- 400+ technical studies
- thinkScript for custom indicators
- Advanced options analysis
- Free with Schwab account
Cons
- Steep learning curve
- Requires brokerage account
- No AI features
- Desktop app can be slow
4. TrendSpider
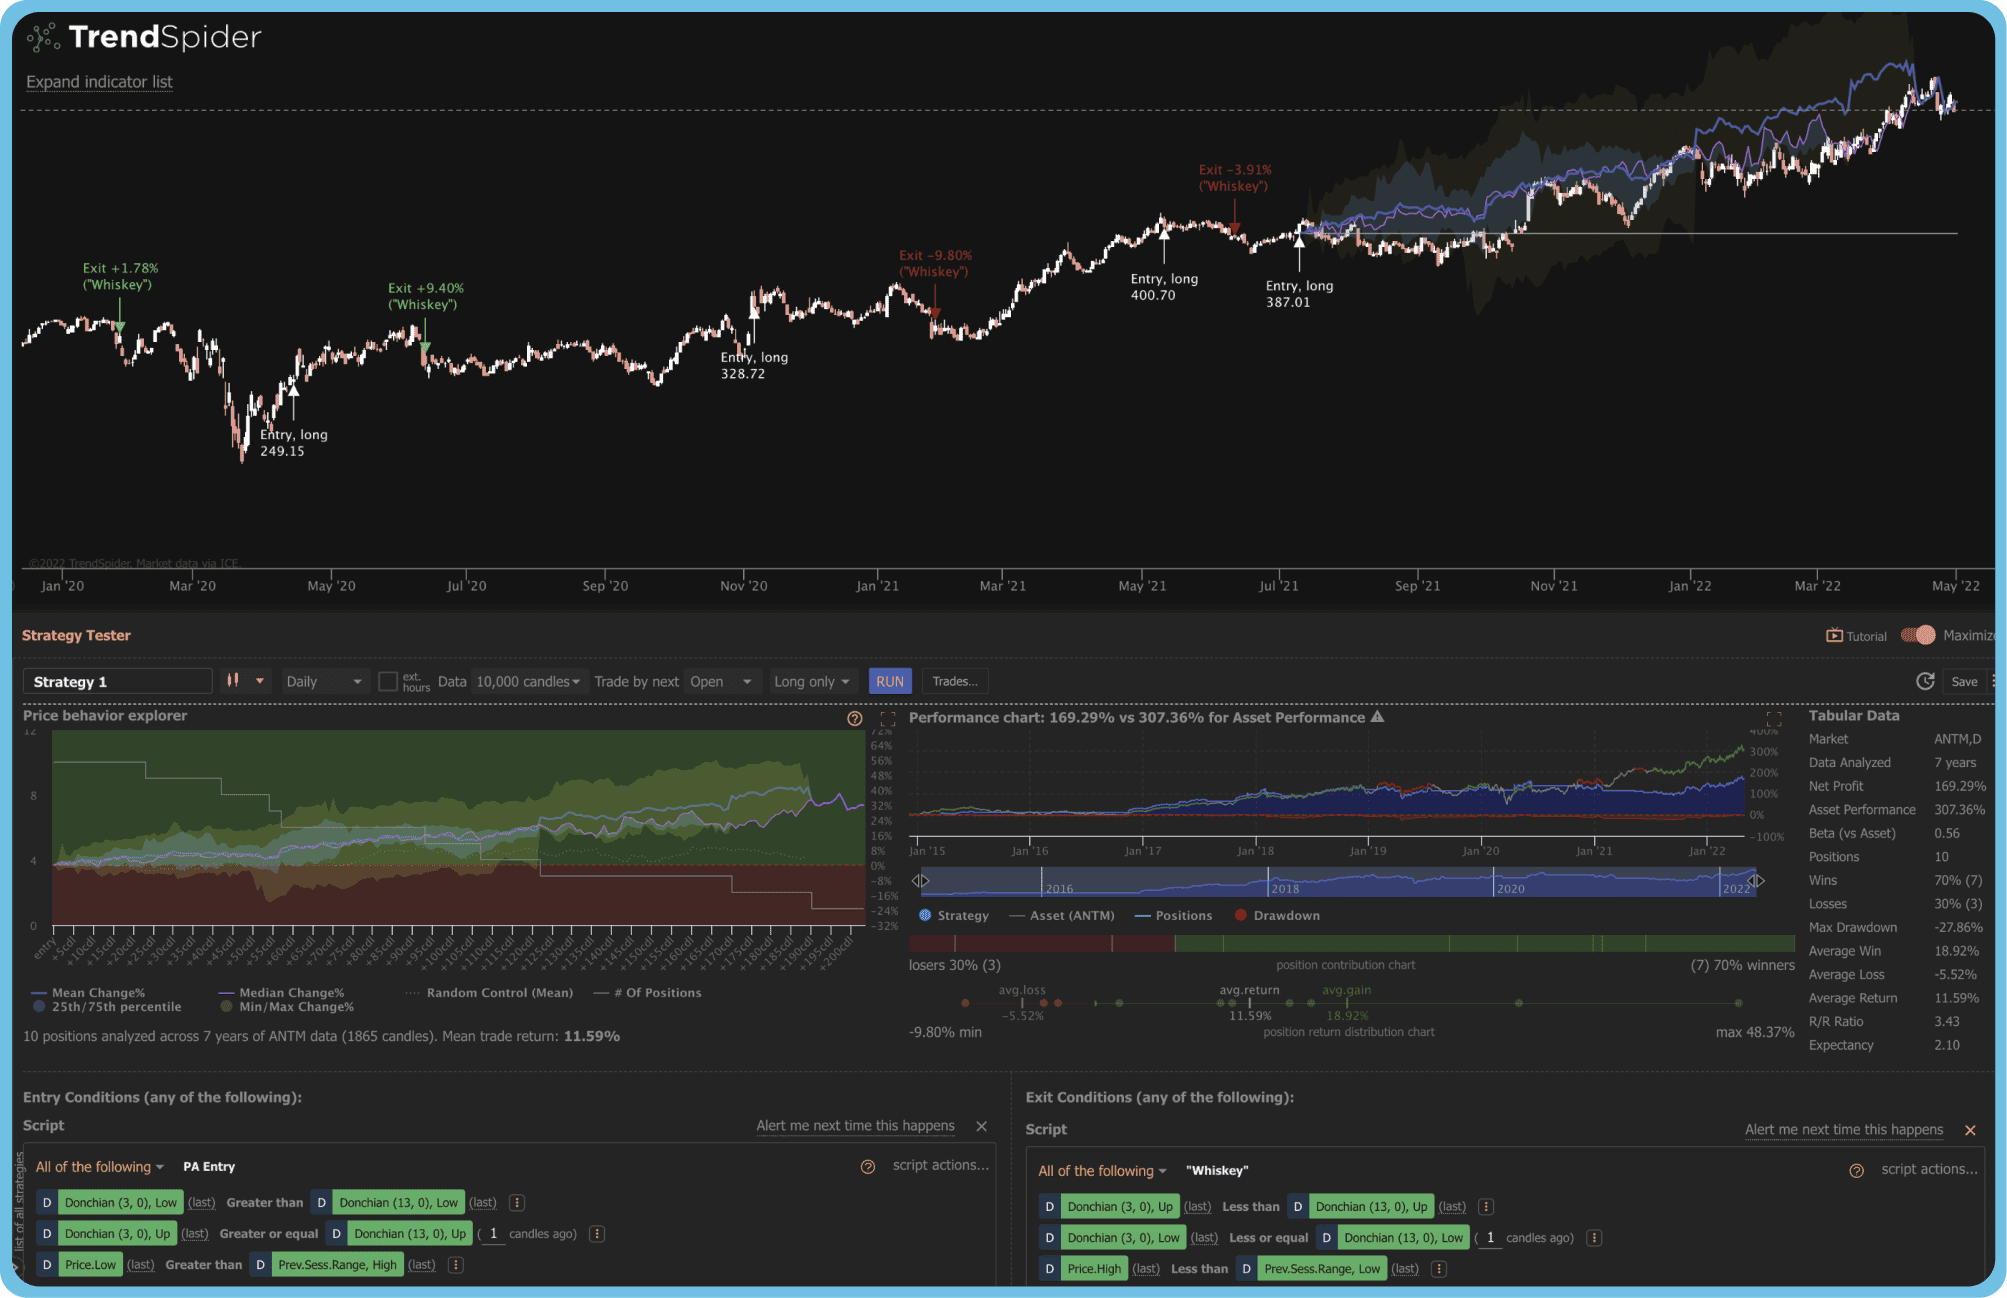
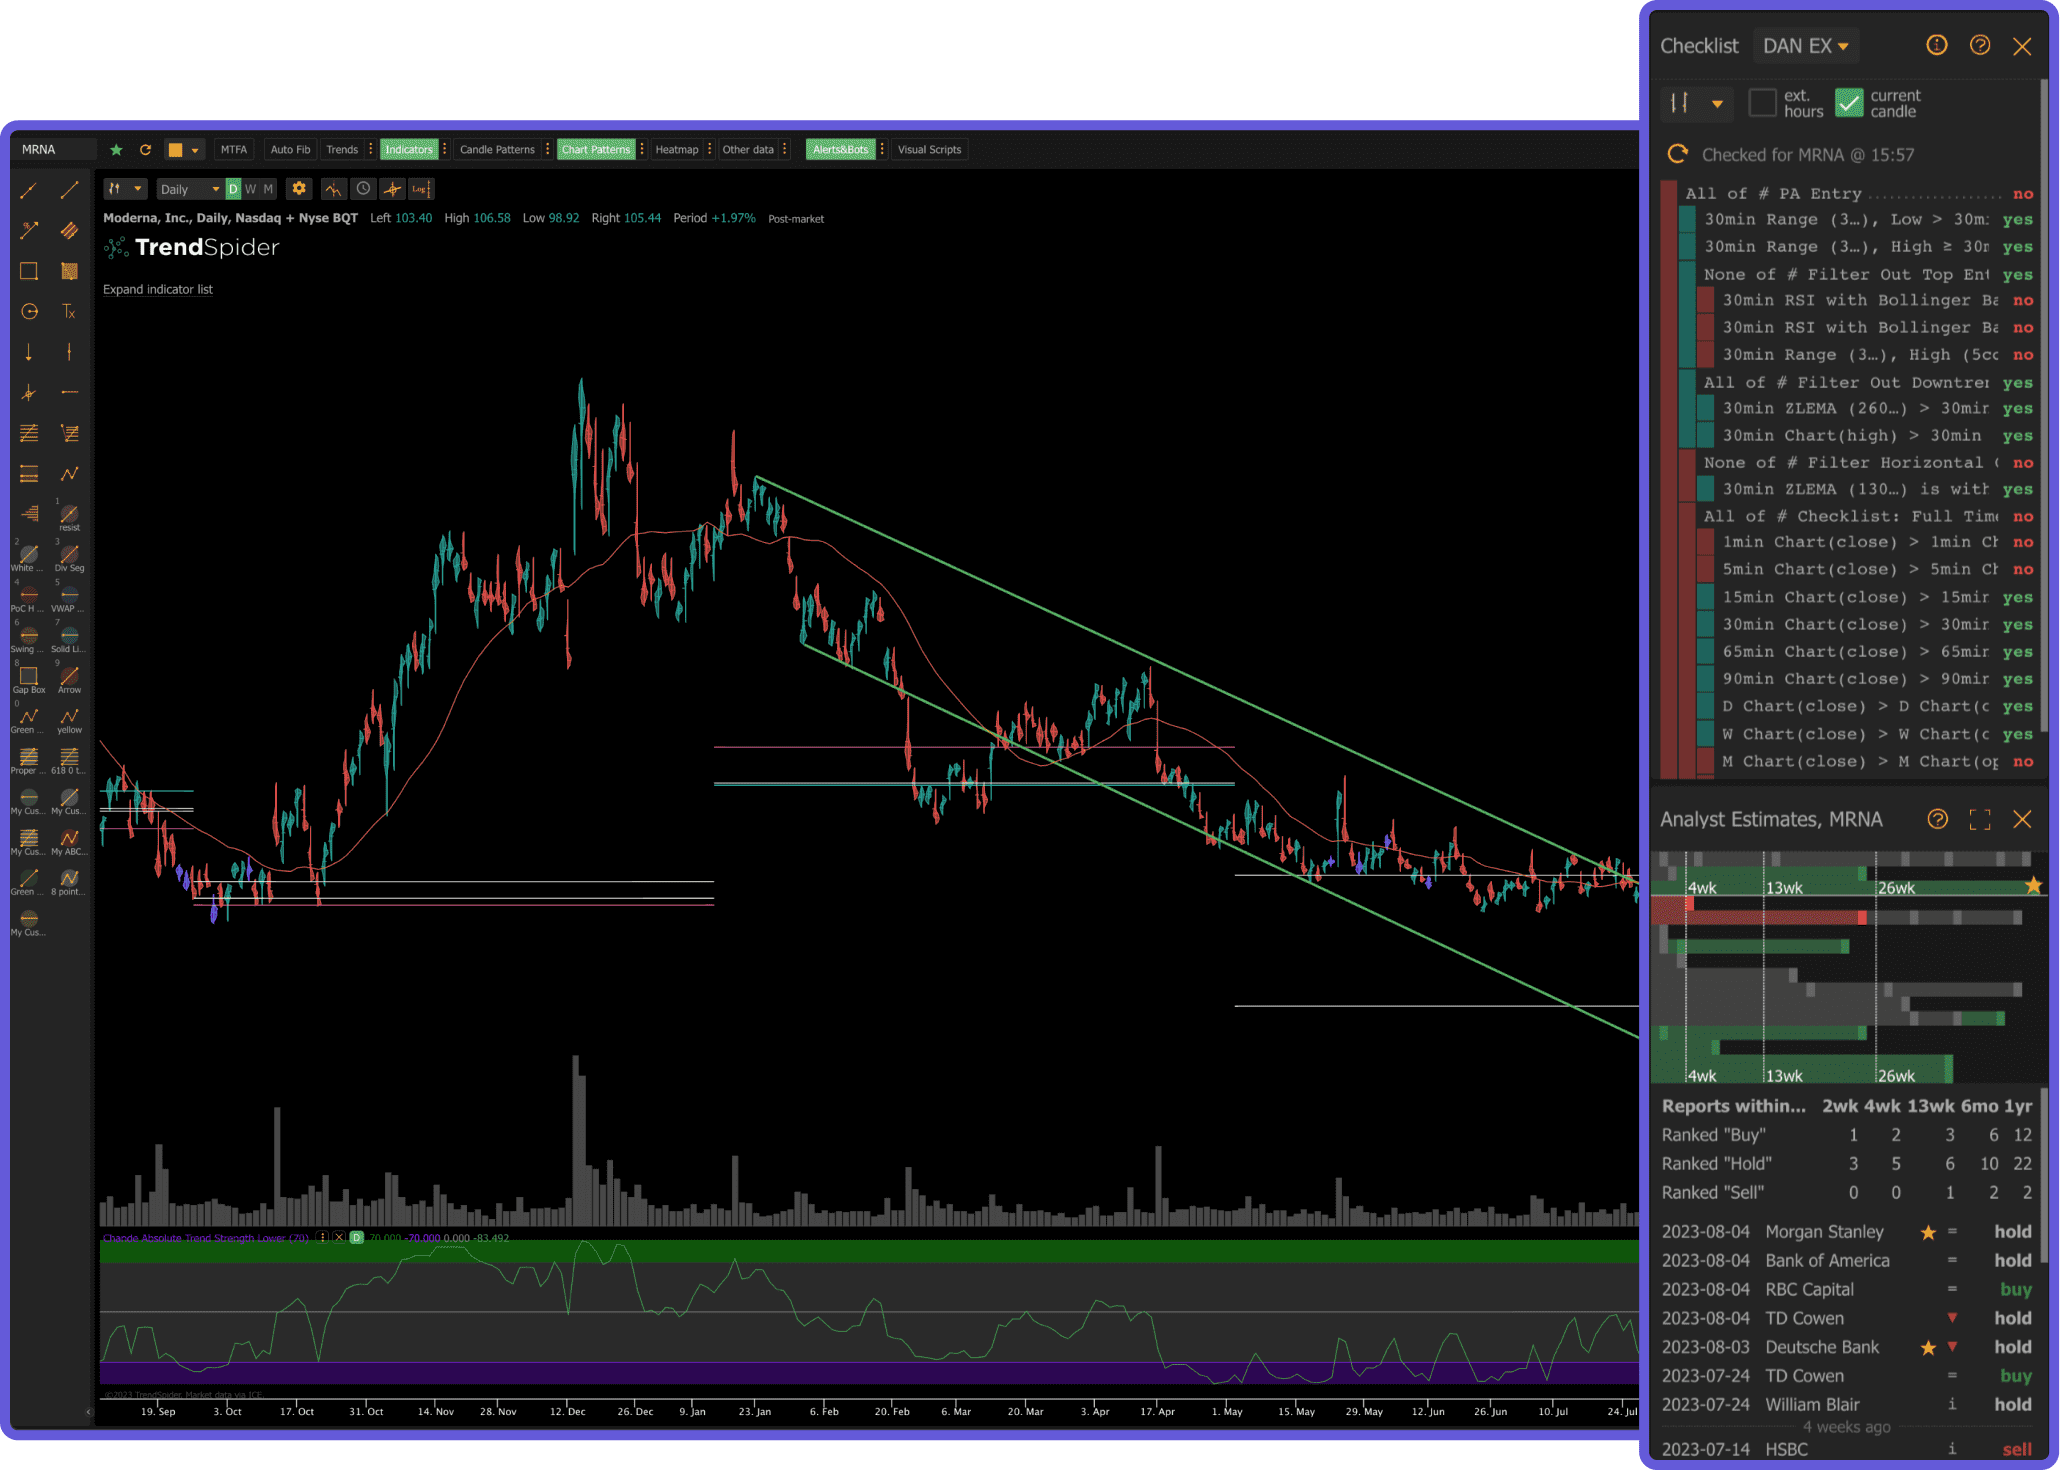
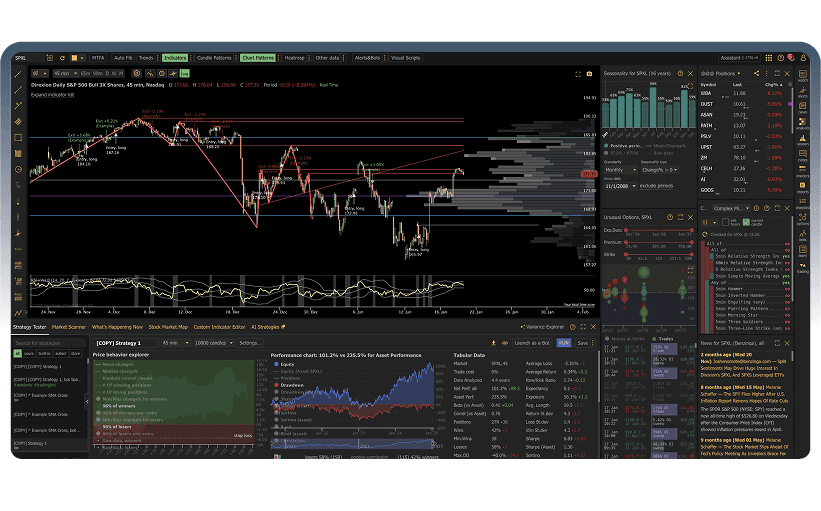
TrendSpider differentiates itself through automated technical analysis. It can automatically detect trendlines, support and resistance levels, Fibonacci retracements, and candlestick patterns. It also offers multi-timeframe analysis on a single chart, which is useful for traders who want to see how RSI or MACD readings align across different timeframes simultaneously.
TrendSpider does not have a free tier. Plans start at $22 per month, which is higher than ChartingLens's premium plan. It also does not offer AI buy/sell signals, insider trading data, or a conversational AI assistant. It is a solid technical analysis tool, but its value proposition is narrower than platforms that bundle AI and unique data features.
Pros
- Automated trendline and pattern detection
- Multi-timeframe analysis on a single chart
- Backtesting engine
Cons
- No free tier
- More expensive than ChartingLens premium
- No AI buy/sell signals or AI assistant
- Smaller user base
Frequently Asked Questions
Conclusion
Technical indicators are not crystal balls. No single indicator, whether it is the RSI indicator, MACD indicator, Bollinger Bands, or any other tool, will predict the market with certainty. What they do is give you a structured, data-driven framework for making trading decisions. The RSI tells you about momentum. MACD reveals trend direction and shifts. Bollinger Bands show you volatility and potential breakouts. VWAP gives you institutional context. The Stochastic oscillator, ATR indicator, Supertrend indicator, Volume Profile, and Ichimoku Cloud each add another dimension to your analysis.
The key is to use indicators that complement each other, understand their strengths and limitations, and apply them consistently within a risk-managed framework. Start with a simple setup, such as RSI + MACD + Bollinger Bands, master it thoroughly, and add complexity only when you have a clear reason to do so. Whether you choose to study the EMA vs SMA comparison for moving average selection or dive deep into Volume Profile for market structure analysis, let your trading style guide your indicator choices. Use our backtesting guide to validate any indicator combination before risking real capital.
The best technical indicators for day trading are the ones you understand deeply and use consistently. Choose a platform that gives you unrestricted access to all of them so that your analysis is never limited by a paywall.
Related Articles
Try All 40+ Indicators for Free
RSI, MACD, Bollinger Bands, VWAP, EMA, and more. Plus AI signals that combine them automatically. No credit card required.
Start Charting Free on ChartingLens