You are reading this because you already know TradingView. You have used it, probably for years. You know the charts are good. You know Pine Script exists. You know the community publishes thousands of indicators. None of that is the problem.
The problem is that you are paying $15 to $60 every month and still running into walls. Indicator limits on your charts. Alerts that cap out before your strategy is fully covered. Ads that persist until you hand over real money. And a growing sense that the platform you once loved is squeezing you harder each year while competitors are shipping features TradingView has never offered, like AI-powered trading signals, automated pattern recognition, and real-time insider data.
This guide is not for beginners exploring their first charting tool. It is for active traders who already pay for a platform — whether TradingView, MetaTrader, or StockCharts — and want to know if there is something better. We will break down exactly what TradingView charges at each tier, what you actually get for that money, and how a platform like ChartingLens delivers more for a fraction of the cost. If you decide to switch, you can be fully set up in about five minutes.
Why Traders Are Leaving TradingView in 2026
TradingView is not a bad platform. It would be dishonest to claim otherwise. But a pattern has emerged over the past two years that has pushed a significant number of serious traders to explore TradingView alternatives. The frustrations are specific, recurring, and well-documented across trading communities.
Price Increases That Keep Coming
TradingView has raised its prices multiple times, and each increase widens the gap between what you pay and what competitors charge for comparable features. The Essential plan now sits at $14.95 per month. The Plus plan, which most active traders need, costs $29.95 per month. The Premium tier runs $59.95 per month. Annualized, that is $180 to $720 per year for charting software alone. For traders who also pay for market data feeds, scanners, or news services, the total software bill adds up fast. Every price increase forces the same calculation: is this specific platform worth this specific dollar amount when alternatives exist?
The Free Tier Has Been Gutted
TradingView's free plan was once a genuinely useful entry point. That era is over. In 2026, the free tier limits you to one indicator per chart, one saved chart layout, one alert total, and a single watchlist. The interface is cluttered with ads. You cannot use server-side alerts. You cannot view multiple charts simultaneously. For anyone running even a basic technical setup like an EMA plus RSI plus MACD, the free plan is not workable. It exists primarily as a funnel to push you toward a paid subscription. If TradingView's free plan is not enough for your trading, you are far from alone.
No AI Features at Any Price
This is the gap that surprises traders the most. Even at the $59.95 Premium tier, TradingView offers zero native AI capabilities. There are no AI buy/sell signals. There is no AI trading assistant you can query about a stock, a pattern, or a strategy. There is no automated chart pattern recognition. Pine Script lets you build custom indicators, but that requires programming knowledge and does not replicate what machine learning models can do when scanning thousands of stocks for high-probability setups. In 2026, AI-powered analysis is no longer a novelty. Traders who want it have to look outside TradingView entirely.
Indicator Limits That Restrict Your Analysis
The per-chart indicator cap is one of the most cited frustrations among TradingView users looking to switch. The Essential plan ($14.95/mo) allows just 2 indicators per chart. The Plus plan ($29.95/mo) allows 5. Only Premium ($59.95/mo) reaches 25 per chart. For traders running multi-indicator strategies, scanning for confluences across moving averages, oscillators, volume profiles, and Bollinger Bands, these limits create constant friction. You either pay more, compromise your setup, or split analysis across multiple charts, none of which is ideal.
Ad-Heavy Experience Below Premium
Unless you are on a paid plan, TradingView displays ads throughout the interface. Even on the Essential tier, certain promotional elements persist. For a platform that charges nearly $15 per month at its lowest paid tier, the continued presence of advertising feels out of step with what traders expect. It is a minor point compared to feature limitations, but it contributes to the broader sentiment that TradingView prioritizes revenue extraction over user experience.
Tired of paying more and getting less? See what you get with ChartingLens.
Start Your Free TrialWhat Serious Traders Actually Need
Before comparing platforms, it helps to define what an active trader actually requires from charting software in 2026. This is not a beginner's checklist. It is what experienced traders, the ones who have already outgrown a basic setup, look for when evaluating whether a platform is worth their money and their time.
Delayed data is not acceptable for active trading. You need live price feeds for stocks and crypto without paying extra for real-time access.
Multi-indicator strategies should not be gated behind premium tiers. Stacking EMAs, RSI, MACD, volume, and Bollinger Bands on a single chart is standard practice.
Machine learning models that scan thousands of stocks and surface high-probability buy/sell setups save hours of manual screening.
Automated detection of head-and-shoulders, double tops, wedges, triangles, and other formations across your watchlist, not just the chart you are staring at.
Seeing what corporate executives and hedge fund managers are buying and selling provides an edge that pure technical analysis misses.
If you are paying for software, you should not be seeing ads. Period. And even on free tiers, an ad-free experience signals a platform that respects its users.
TradingView checks one of these boxes fully (real-time data on paid plans) and partially checks another (indicators, but with per-chart limits that scale with price). It misses entirely on AI signals, pattern recognition, insider data, and ad-free experience at lower tiers. This is not a matter of opinion. These features either exist on the platform or they do not. And on TradingView, they do not.
The Real Cost of TradingView: Tier-by-Tier Breakdown
Let us be precise about what TradingView charges and what you actually receive at each pricing tier. This matters because many traders subscribe to TradingView without fully understanding what is locked behind each paywall. If you are evaluating whether TradingView is worth it, or whether a cheaper TradingView Pro alternative exists, these details will clarify the decision.
TradingView Free
- 1 indicator per chart
- 1 chart layout saved
- 1 alert total
- 1 watchlist
- Ads displayed throughout the interface
- No server-side alerts
- No multi-chart layouts
- No AI features of any kind
- No insider trading data
TradingView Essential
- 2 indicators per chart
- 5 saved chart layouts
- 20 alerts
- 1 watchlist with up to 1,000 symbols
- No ads
- No server-side alerts
- 2 charts per tab
- No AI features
- No insider trading data
TradingView Plus
- 5 indicators per chart
- 10 saved chart layouts
- 100 alerts (server-side included)
- 1 watchlist
- No ads
- 4 charts per tab
- 10 active server-side alerts
- No AI features
- No insider trading data
TradingView Premium
- 25 indicators per chart
- Unlimited saved chart layouts
- 400 alerts (server-side included)
- Unlimited watchlists
- No ads
- 8 charts per tab
- 400 active server-side alerts
- No AI features
- No insider trading data
- No auto pattern recognition
Notice what remains absent at every tier: AI buy/sell signals, an AI trading assistant, automated chart pattern recognition, insider trading data, and hedge fund holdings. These are not edge-case features. For a growing number of traders, they are central to their workflow. TradingView's highest tier at $59.95 per month still does not offer them.
The question is not whether TradingView Premium is worth $59.95. The question is whether a platform like TradingView but cheaper, and with more features, exists. It does.
ChartingLens: Built for Traders Who Outgrew TradingView
We are not going to position ChartingLens as the "budget option." It is not. It is the platform that traders move to when TradingView stops meeting their needs, because it offers capabilities TradingView has not built and may never build, at a price point that makes the comparison uncomfortable for TradingView.
ChartingLens was designed from the ground up for serious traders who need more than static charts and a scripting language. Here is what the platform delivers.
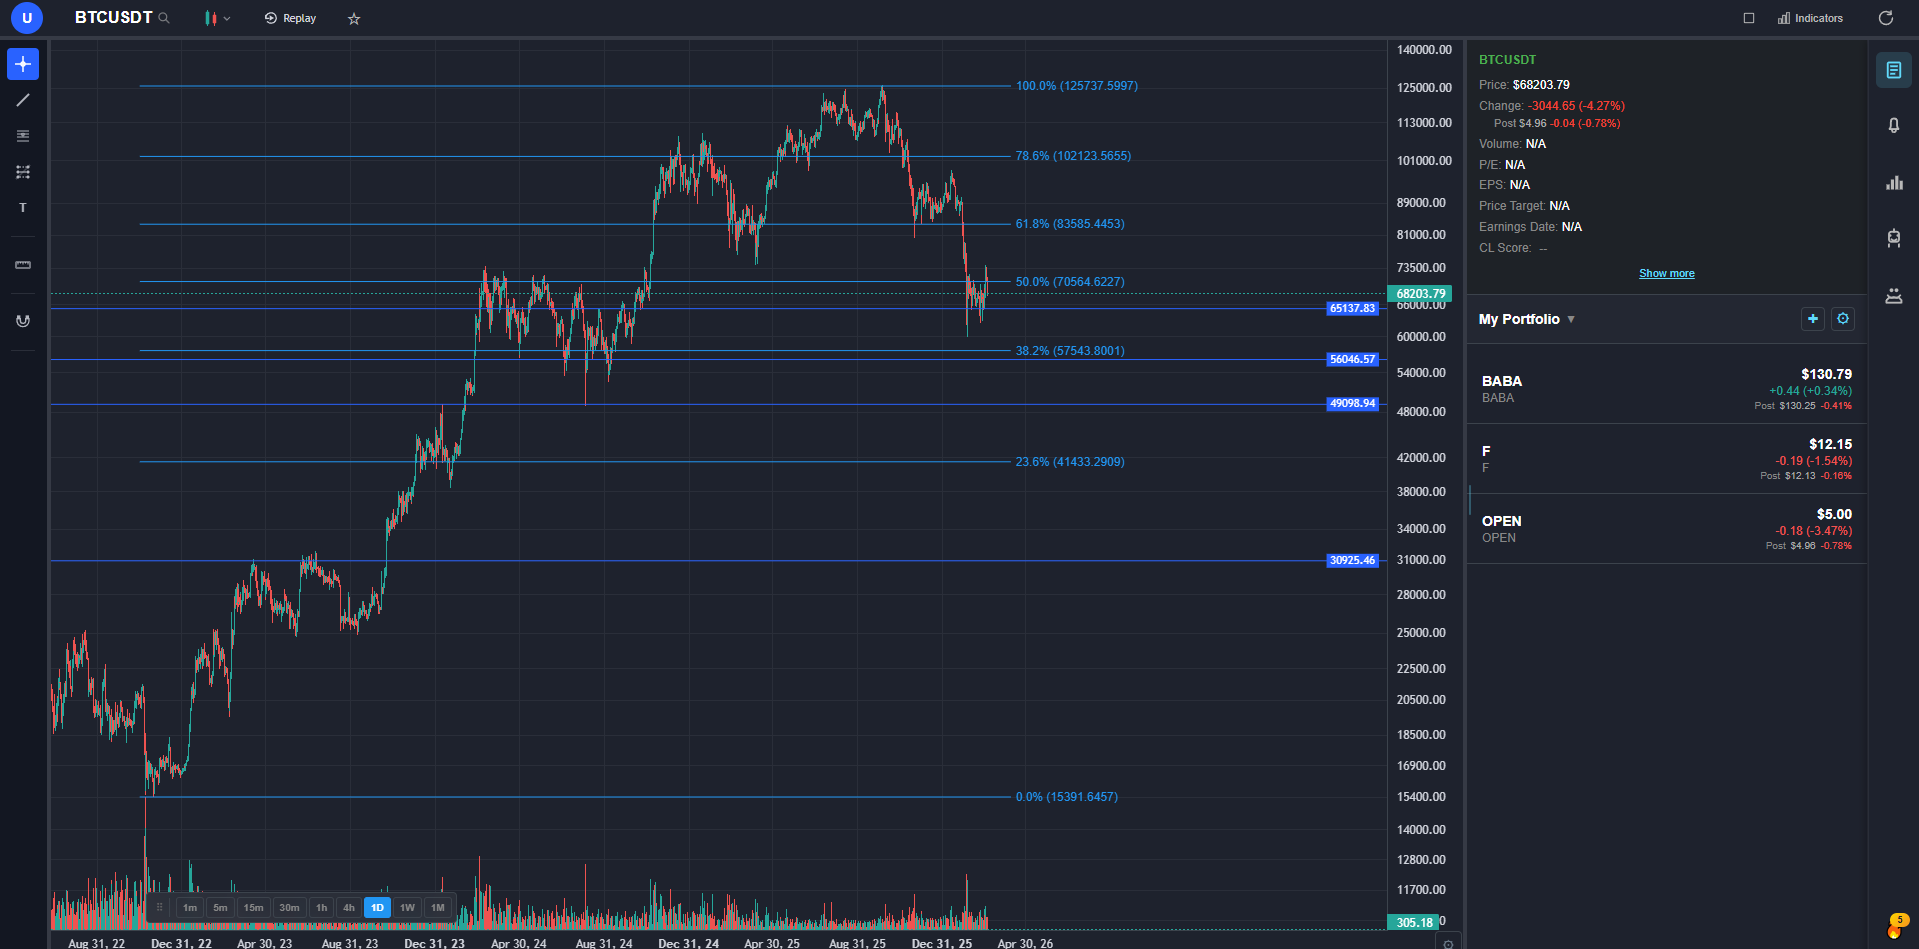
40+ technical indicators with no per-chart limit. On the free tier. Stack as many indicators as your strategy demands on a single chart. EMAs, RSI, MACD, Bollinger Bands, VWAP, Stochastic, ADX, and more. There is no artificial cap designed to push you toward a higher plan. This alone eliminates the single biggest frustration TradingView users report.
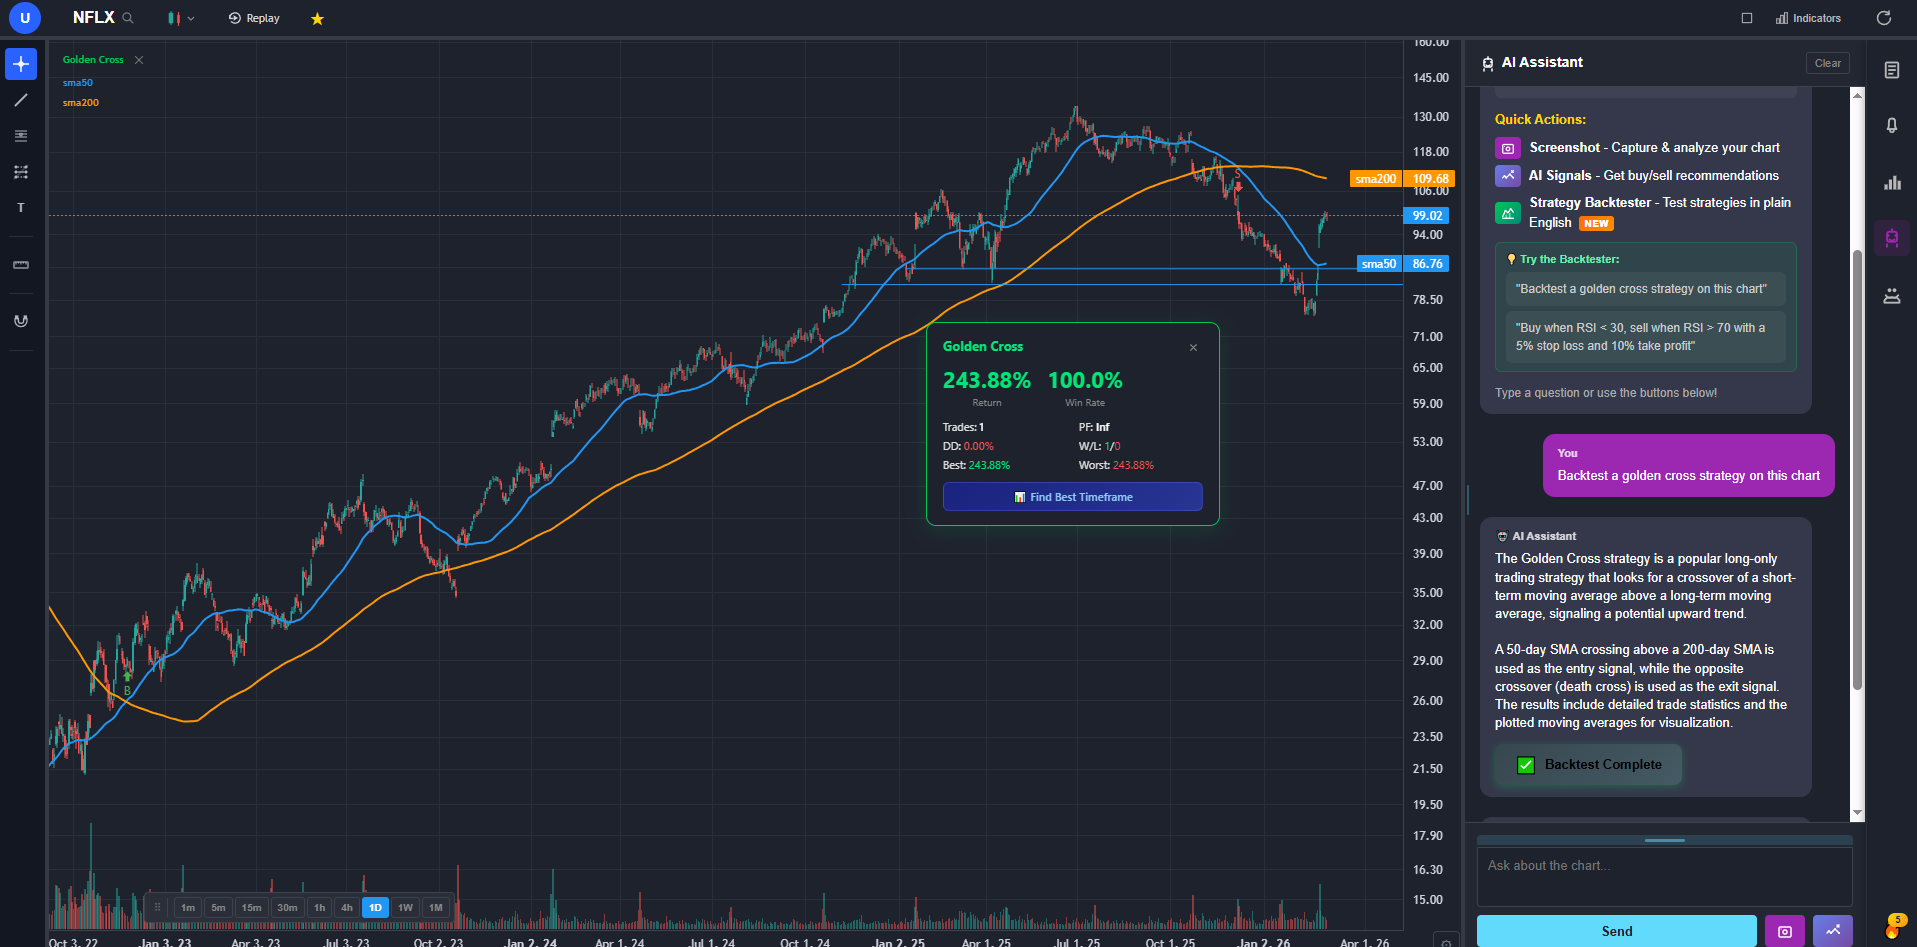
AI buy/sell signals across 2,000+ stocks. ChartingLens runs machine learning models that scan the market continuously and generate buy and sell signals based on technical confluences, momentum shifts, and pattern formations. These are not community-published Pine Script indicators. They are proprietary AI models built into the platform. You see the signals directly on your charts and in a dedicated signals dashboard.
AI trading assistant. Ask questions about any stock, any chart pattern, or any trading concept, and get an intelligent response grounded in market data. This is not a generic chatbot. It is a purpose-built AI assistant for traders that understands technical analysis, fundamental context, and market dynamics. Available on the free tier.
Automated chart pattern recognition (13+ patterns). The platform automatically detects head-and-shoulders, double tops, double bottoms, ascending triangles, descending triangles, wedges, flags, pennants, cup-and-handle formations, and more. Pattern recognition runs across your watchlist, not just the chart you happen to be viewing. You get alerted to formations as they develop, giving you time to plan entries and exits.
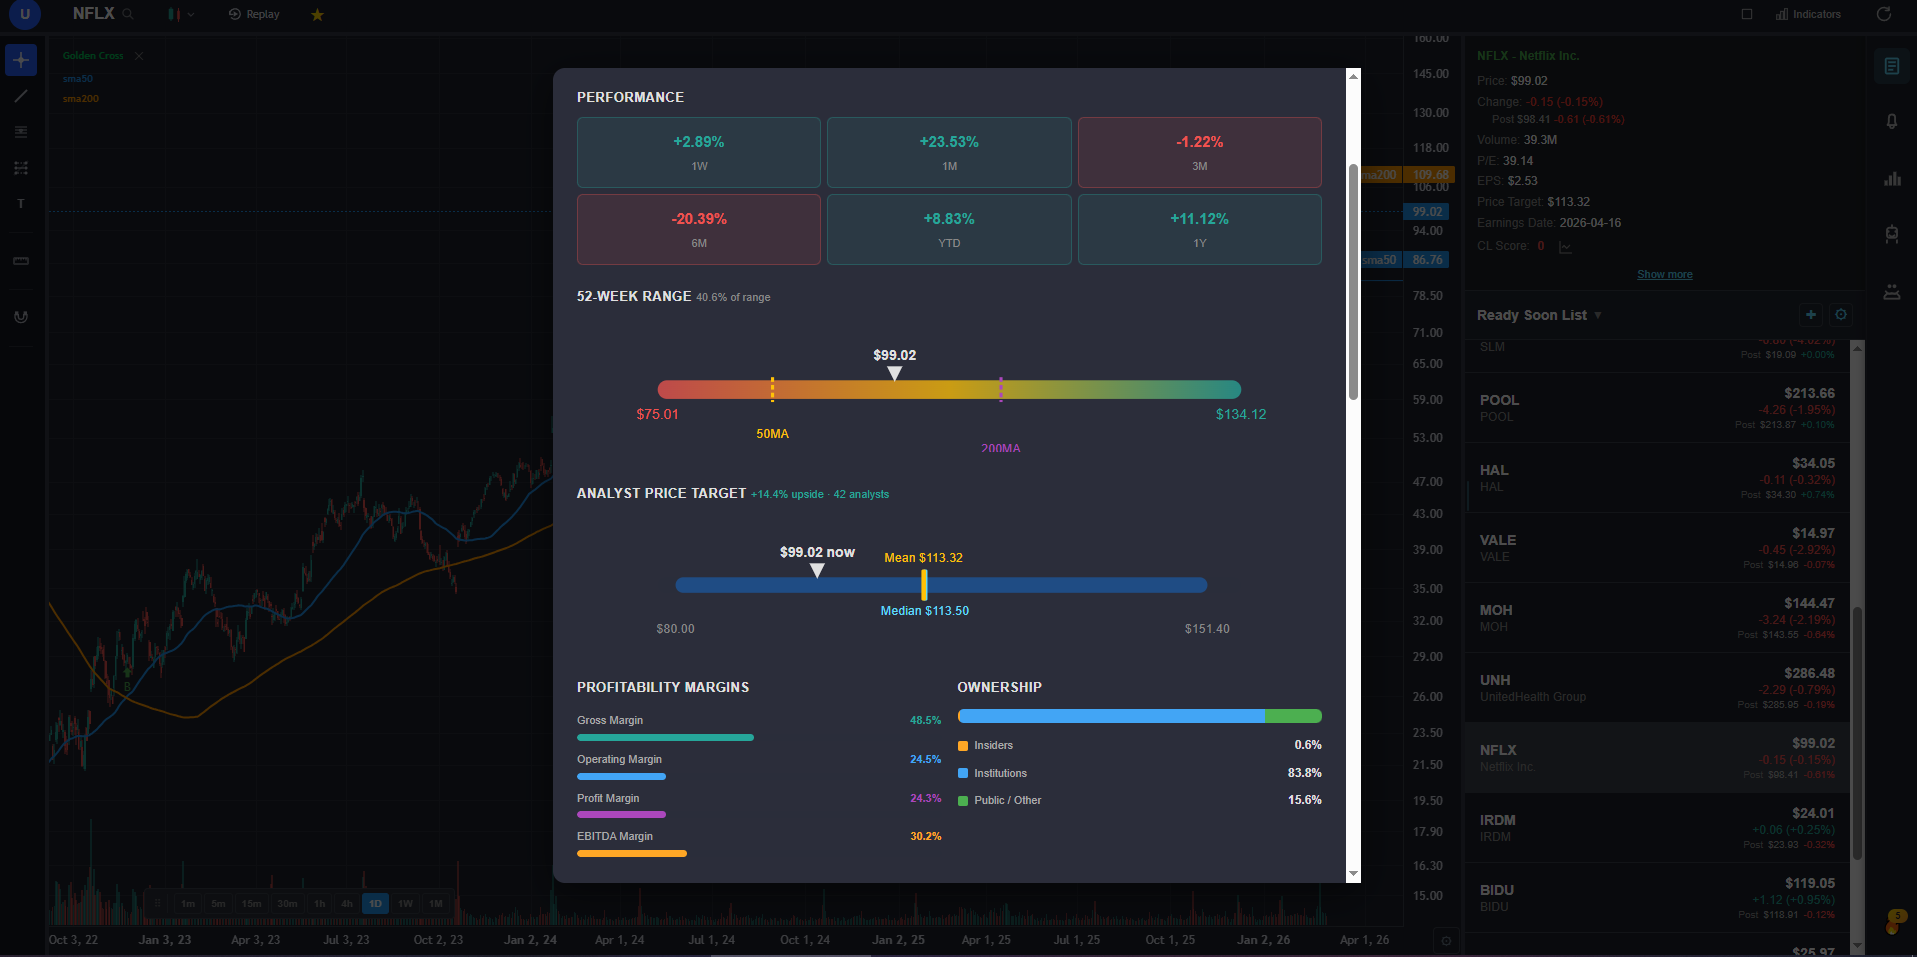
Real-time insider trading data and hedge fund holdings. See what corporate insiders, CEOs, CFOs, board members, are buying and selling in real time. Track the portfolio moves of legendary investors like Warren Buffett, Ray Dalio, and other hedge fund managers through 13F filings integrated directly into the platform. This data layer adds a dimension of analysis that no amount of TradingView indicators can replicate.
Volume Candles chart type. ChartingLens Premium includes Volume Candles, a professional chart type where each candlestick's width is proportional to its trading volume. High-volume bars appear wider, low-volume bars appear thinner, giving you an instant visual read on where institutional activity is concentrated. TradingView charges $67.95/month (Premium tier) for Volume Candles. ChartingLens includes them at $14.99/mo.
Volume Profile (VRVP). Visible Range Volume Profile shows how trading volume is distributed across price levels, highlighting the Point of Control, Value Area High, and Value Area Low. On TradingView, Volume Profile requires the Plus plan at $29.95 per month. On ChartingLens, it is available on Premium at $14.99 per month.
Real-time stock and crypto charts. Live price data for stocks and cryptocurrency. No delayed feeds. No additional data fees. Charts load fast, render cleanly, and update in real time, exactly what you expect from a modern trading platform.
No ads on any tier. The free tier has no ads. The premium tier has no ads. There is no tier on ChartingLens that displays advertising of any kind. The interface stays clean and focused on your analysis.
Strategy backtesting in plain English. Describe any trading strategy and ChartingLens tests it against historical data. Free users get two built-in strategies (Golden Cross and RSI Mean Reversion) with AI-powered timeframe optimization that automatically finds the best-performing timeframe across 15m, 1h, 4h, and daily charts. Premium users can create unlimited custom strategies — any entry/exit logic you can describe, the AI generates executable code and runs a full backtest with Sharpe ratio, win rate, max drawdown, and trade-by-trade breakdowns. No Pine Script required.
Premium at $14.99/mo. The optional premium plan unlocks unlimited custom backtesting, deeper AI analysis, extended historical data, and priority access to new features. At $14.99 per month, it costs less than TradingView's cheapest paid plan ($14.95) while including features that TradingView does not offer at any price.
What You Gain by Switching
- AI buy/sell signals (TradingView: not available)
- AI trading assistant (TradingView: not available)
- Auto chart pattern recognition (TradingView: not available)
- Insider trading data (TradingView: not available)
- Hedge Fund Holdings (TradingView: not available)
- Strategy backtesting in plain English (TradingView: requires Pine Script)
- AI timeframe optimization (TradingView: not available)
- Volume Candles at $14.99/mo (TradingView: $67.95/mo)
- Volume Profile (VRVP) at $14.99/mo (TradingView: $29.95+/mo)
- Unlimited indicators per chart on free tier
- No ads on any tier
- $14.99/mo premium vs $29.95+/mo
What to Consider
- Smaller community than TradingView
- No Pine Script equivalent yet
- No built-in brokerage integration
- Newer platform, still adding features
The positioning here is deliberate. ChartingLens is not competing with TradingView on community size or scripting ecosystem. It is competing on the features that actually drive better trading decisions: AI signals, pattern recognition, insider intelligence, and a pricing model that does not punish you for wanting more than two indicators on a chart.