Why Charting Software Matters
Good charting software is the foundation of every trading decision. Whether you are a day trader hunting for intraday patterns, a swing trader identifying multi-week setups, or a long-term investor timing your entries, the quality of your charts directly influences the quality of your analysis. The right free stock charting software gives you real-time price data, technical indicators, drawing tools, and increasingly, AI-powered features that can surface opportunities you might otherwise miss.
The landscape of free stock charts has changed dramatically over the past few years. Platforms that once required expensive desktop installations — like MetaTrader — now run entirely in the browser. AI-driven analysis, once the domain of hedge funds with million-dollar budgets, is now accessible on platforms costing less than a Netflix subscription. And data that used to be buried in SEC filings, such as insider trades and hedge fund holdings moves, is now visualized alongside your charts.
But with so many options available, choosing the best free charting software can be overwhelming. Some platforms lure you in with a "free" label only to wall off essential features behind steep paywalls. Others are genuinely generous but lack the depth that serious traders need. If you are specifically looking to switch from TradingView, our TradingView alternatives comparison dives deeper into that decision. For a focused look at indicator and drawing tool quality, see our roundup of free technical analysis tools. In this guide, we put seven of the most popular charting tools through a rigorous evaluation so you do not have to guess. We will break down what each platform does well, where it falls short, and which one matches your specific trading style.
How We Evaluated Each Platform
To ensure a fair and useful comparison, we tested every platform against six criteria that matter most to traders looking for free stock charting software.
How many indicators are available on the free tier, and can you stack multiple indicators on one chart?
Does the platform offer AI-assisted analysis, AI signals, or an AI trading assistant?
What do you actually get for free, and how much does it cost to unlock more?
How quickly can a new user create a chart, apply indicators, and navigate the interface?
Does the free tier include live, real-time price data or is it delayed?
What sets this platform apart from the rest, such as insider data, social tools, or options chains?
Each platform received a hands-on review using its free tier (or default offering). We focused on the charting experience specifically, since many of these platforms also offer brokerage, news, or education services that fall outside the scope of this comparison.
In-Depth Reviews of All 7 Platforms
1. ChartingLens
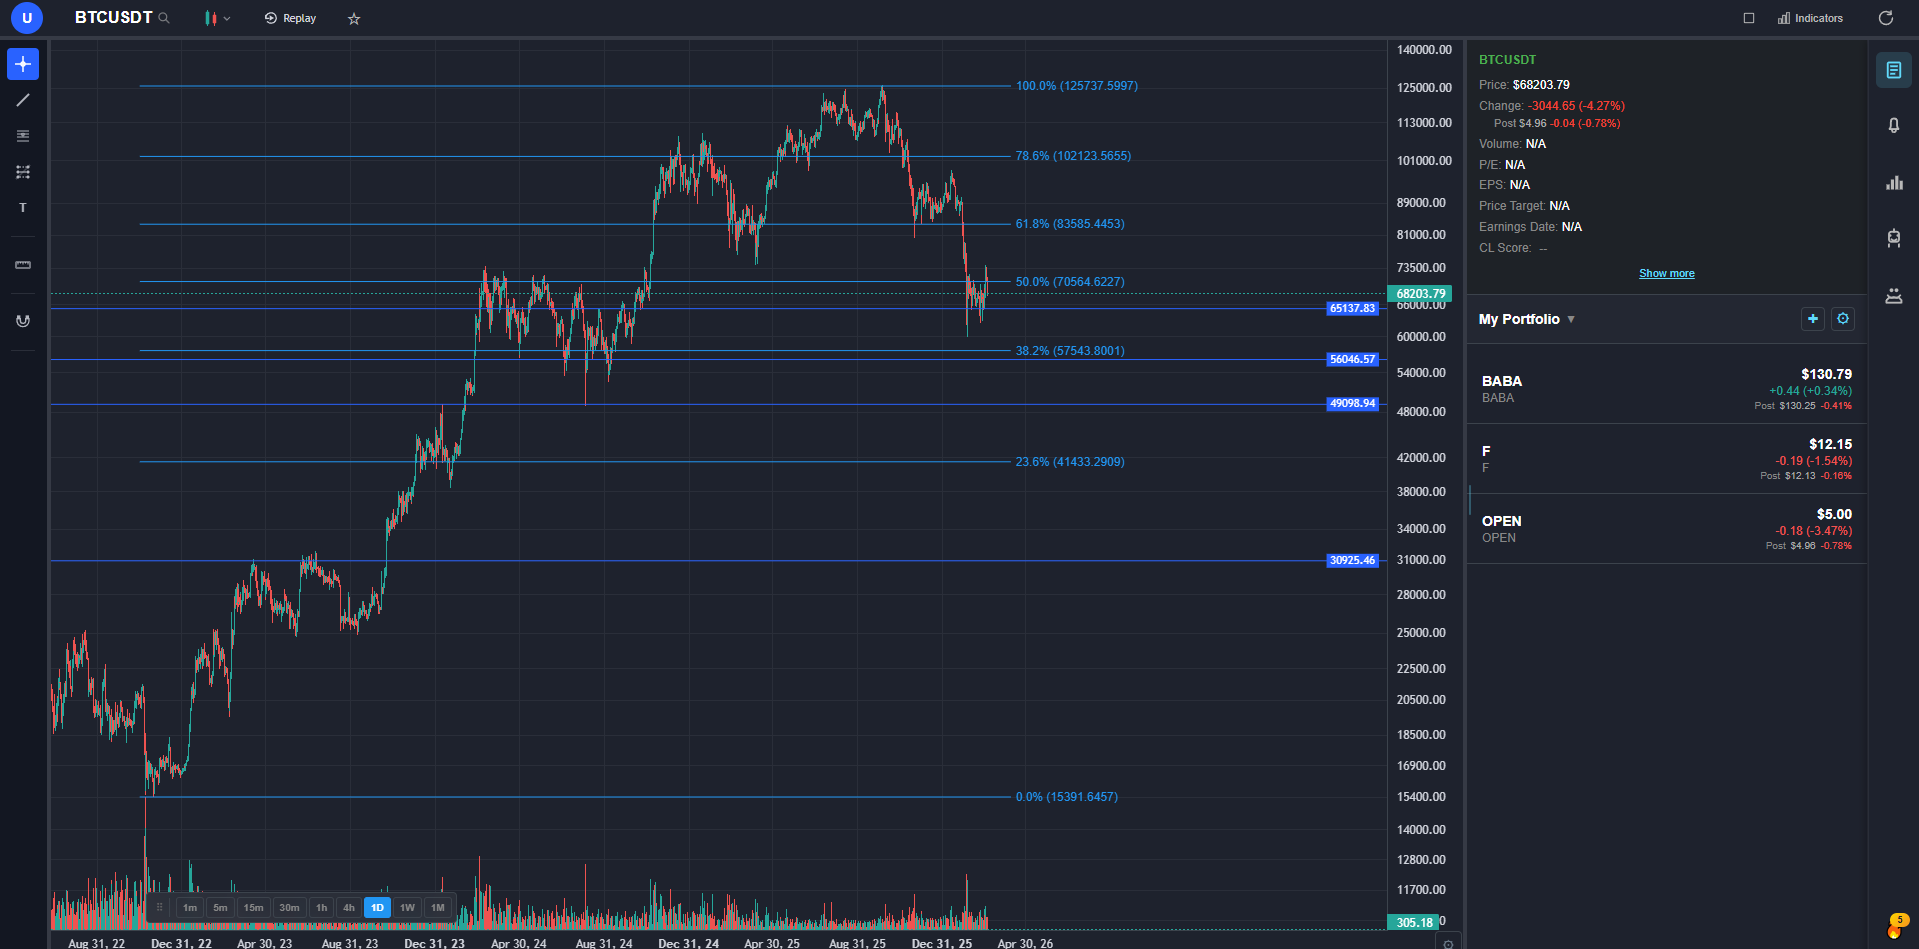
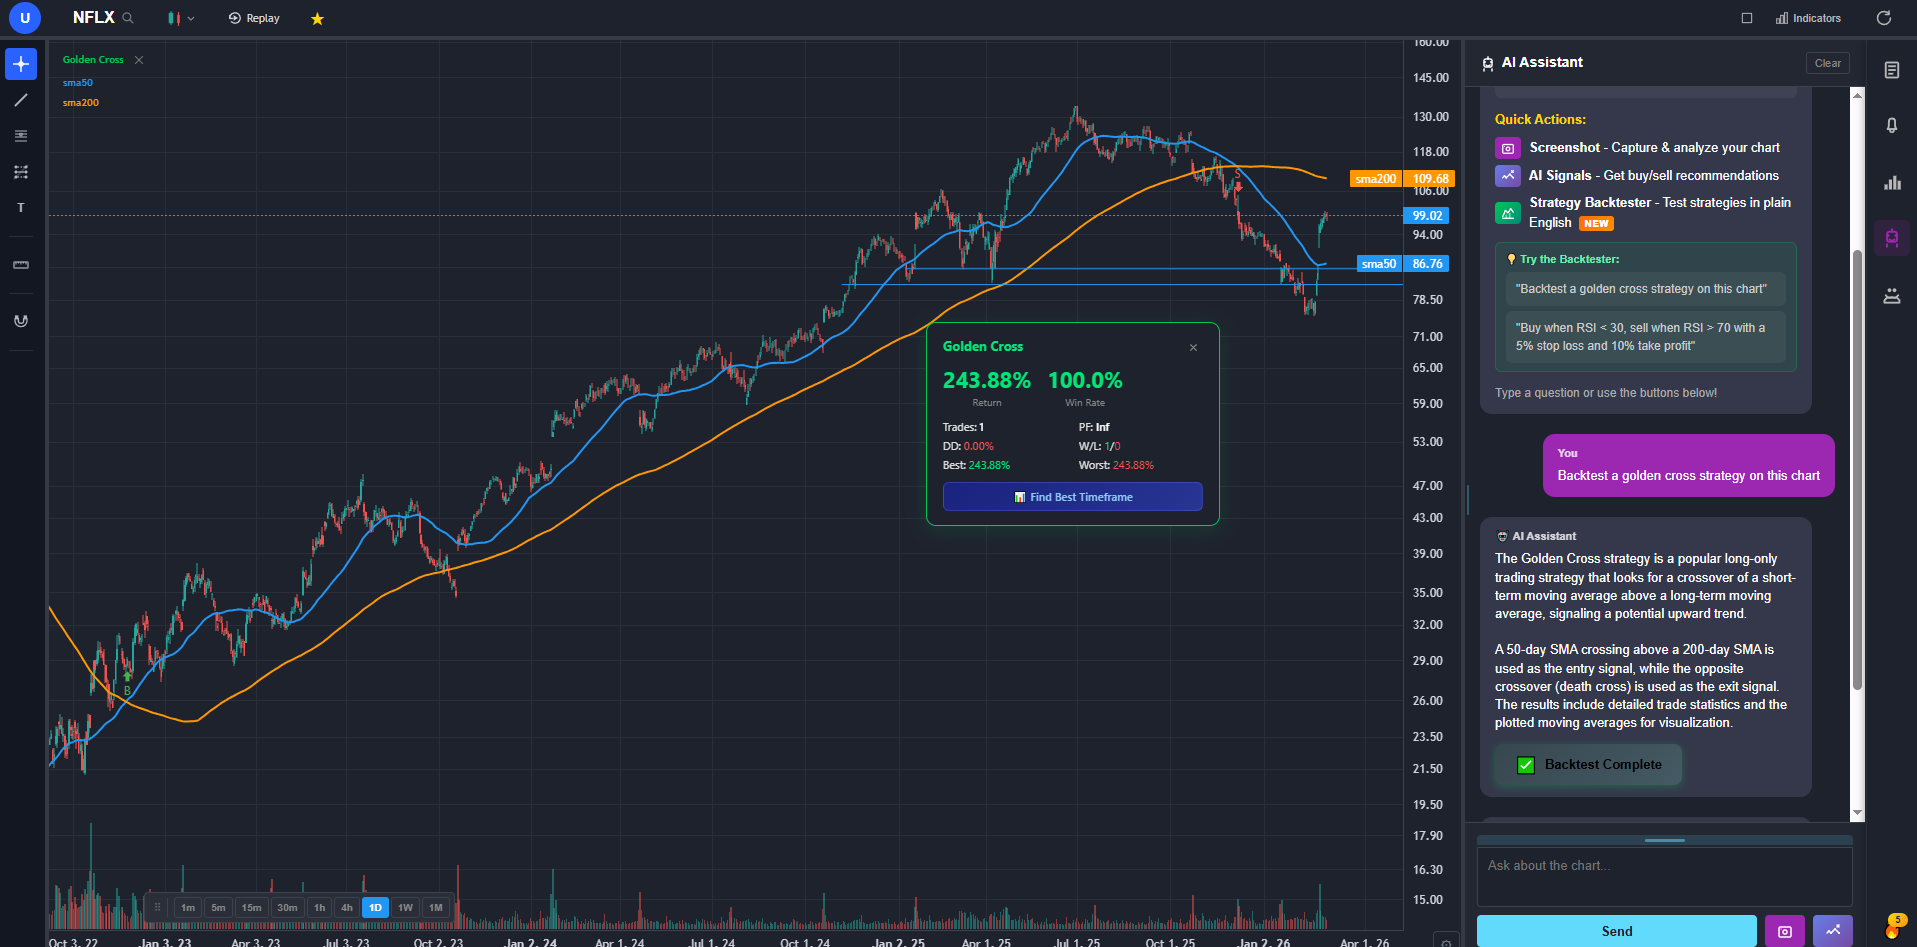
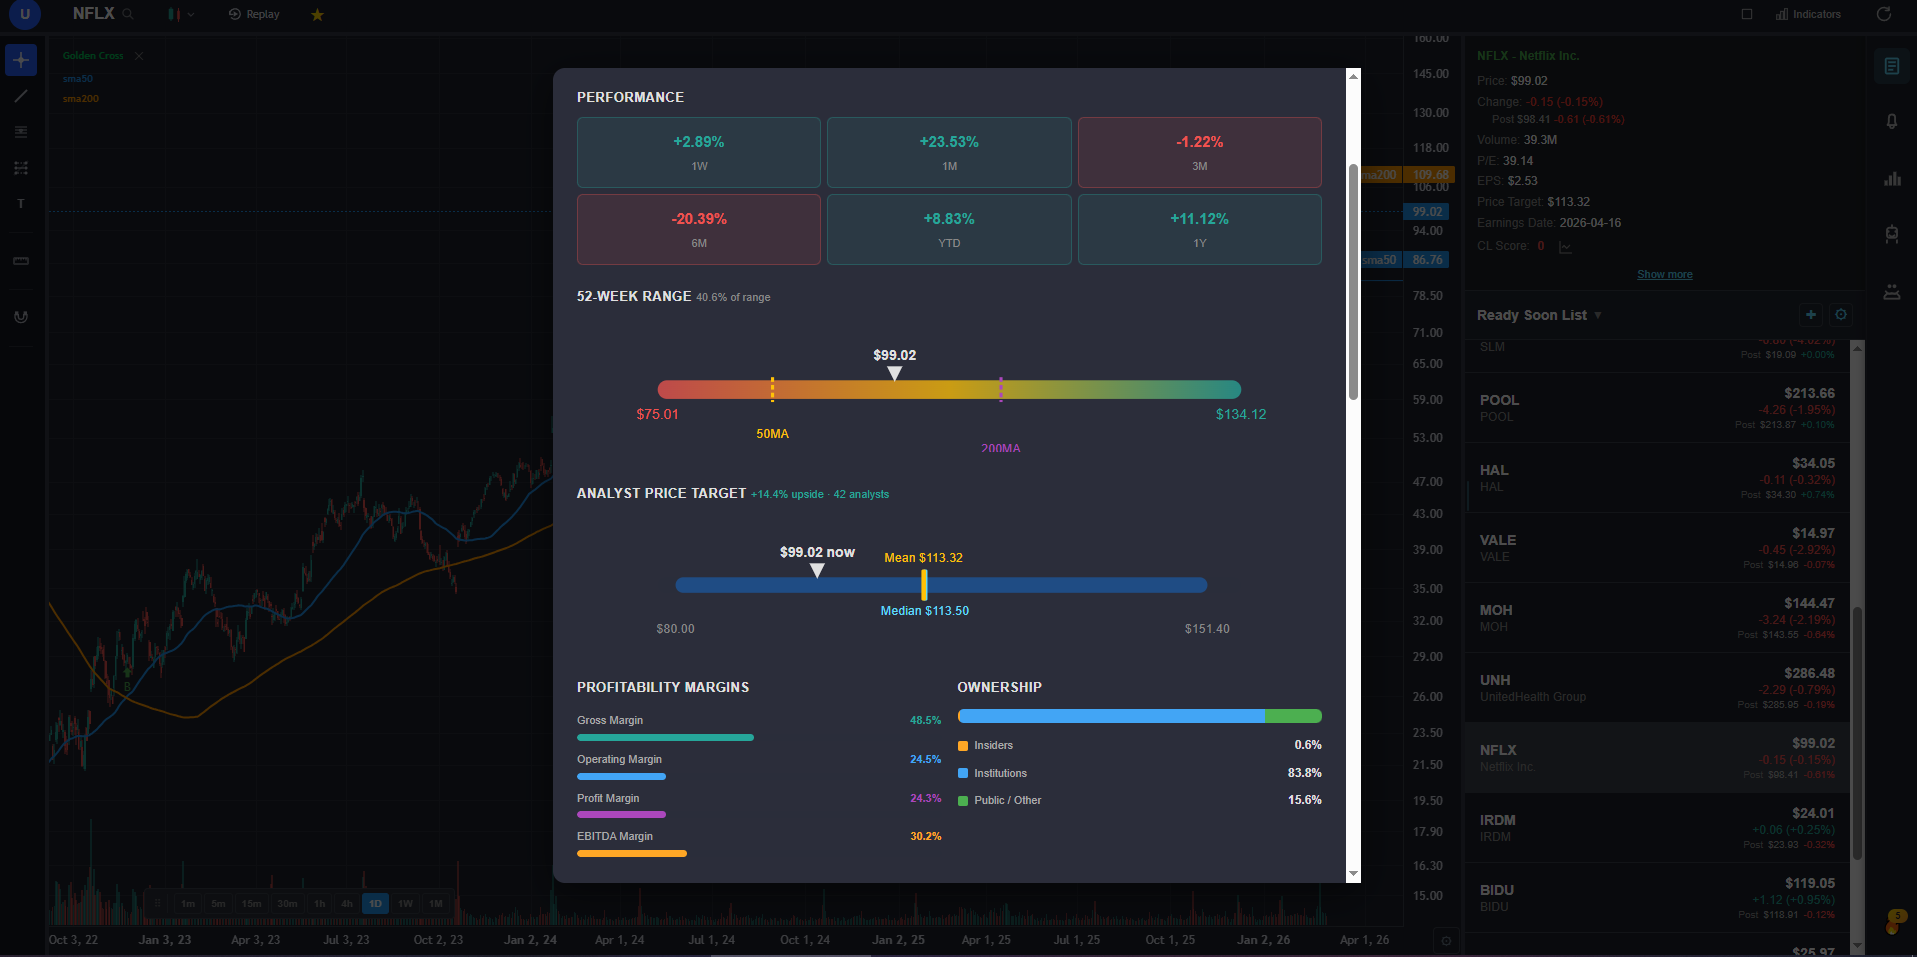
ChartingLens is a web-based charting platform built from the ground up with AI at its core. The free tier includes live stock and crypto charts, over 40 technical indicators (RSI, MACD, Bollinger Bands, EMA, and more), drawing tools with cloud sync, and access to a feature that most competitors do not offer at any price: real-time insider trading data and hedge fund holdings. You can see what executives are buying and selling in their own companies, and track the holdings of legendary investors like Warren Buffett and Michael Burry, directly alongside your charts.
What truly differentiates ChartingLens is its approach to AI-assisted trading. The platform offers AI buy signals that scan over 2,000 stocks to identify high-probability setups, an AI trading assistant you can ask questions about any stock or chart, and a proprietary CL Score that rates stocks using machine learning. These are not gimmicks bolted on as an afterthought; they are integrated into the charting workflow. The premium tier at $14.99 per month unlocks additional AI depth, but the free version already includes more AI functionality than most paid platforms.
The interface is clean and modern, with no ads on any tier. New users can be charting within seconds of signing up. It runs entirely in the browser, so there is nothing to install. If you care about understanding the "smart money" side of the market through tracking insider trading and hedge fund holdings moves while also getting AI-driven signals, ChartingLens is the strongest option available today.
Pros
- 40+ indicators on the free tier
- AI buy signals, AI assistant, CL Score
- Insider trading data and hedge fund holdings included free
- No ads on any tier
- Clean, fast, browser-based interface
- Premium at just $14.99/mo is the lowest paid tier among all reviewed platforms
Cons
- Newer platform with a smaller community than TradingView
- No custom scripting language (yet)
- No built-in brokerage or order execution
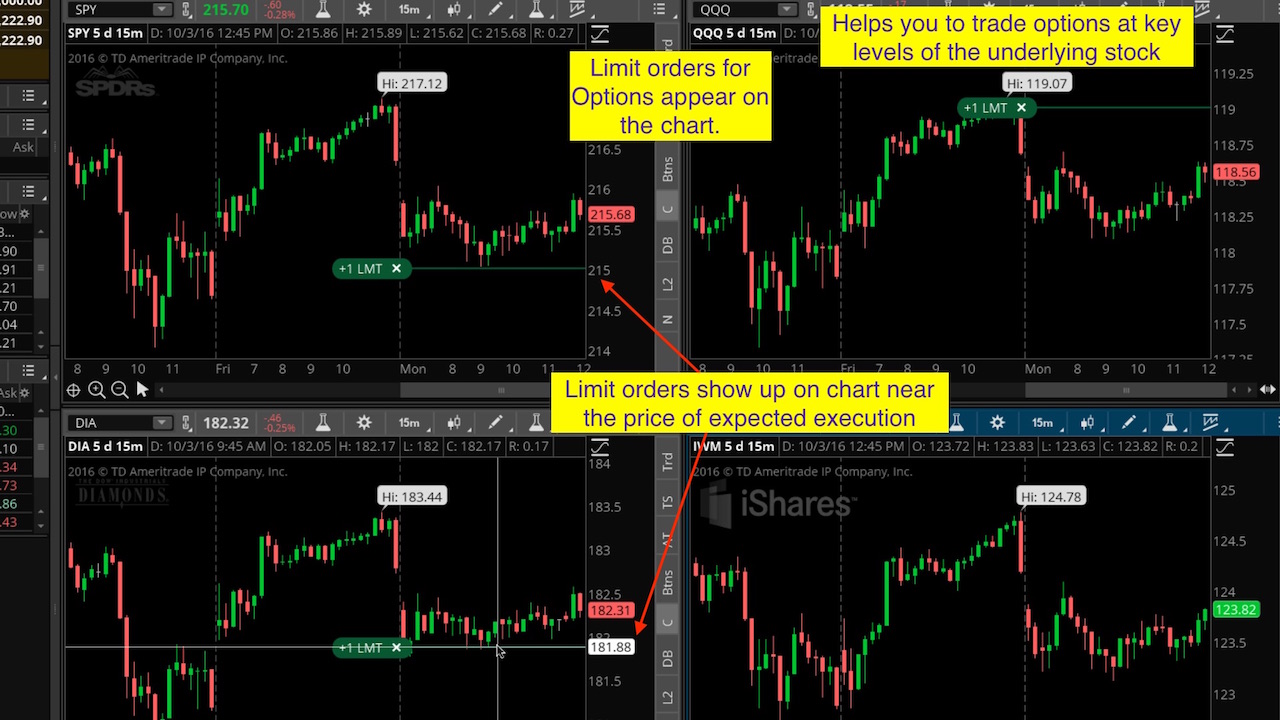
2. TradingView


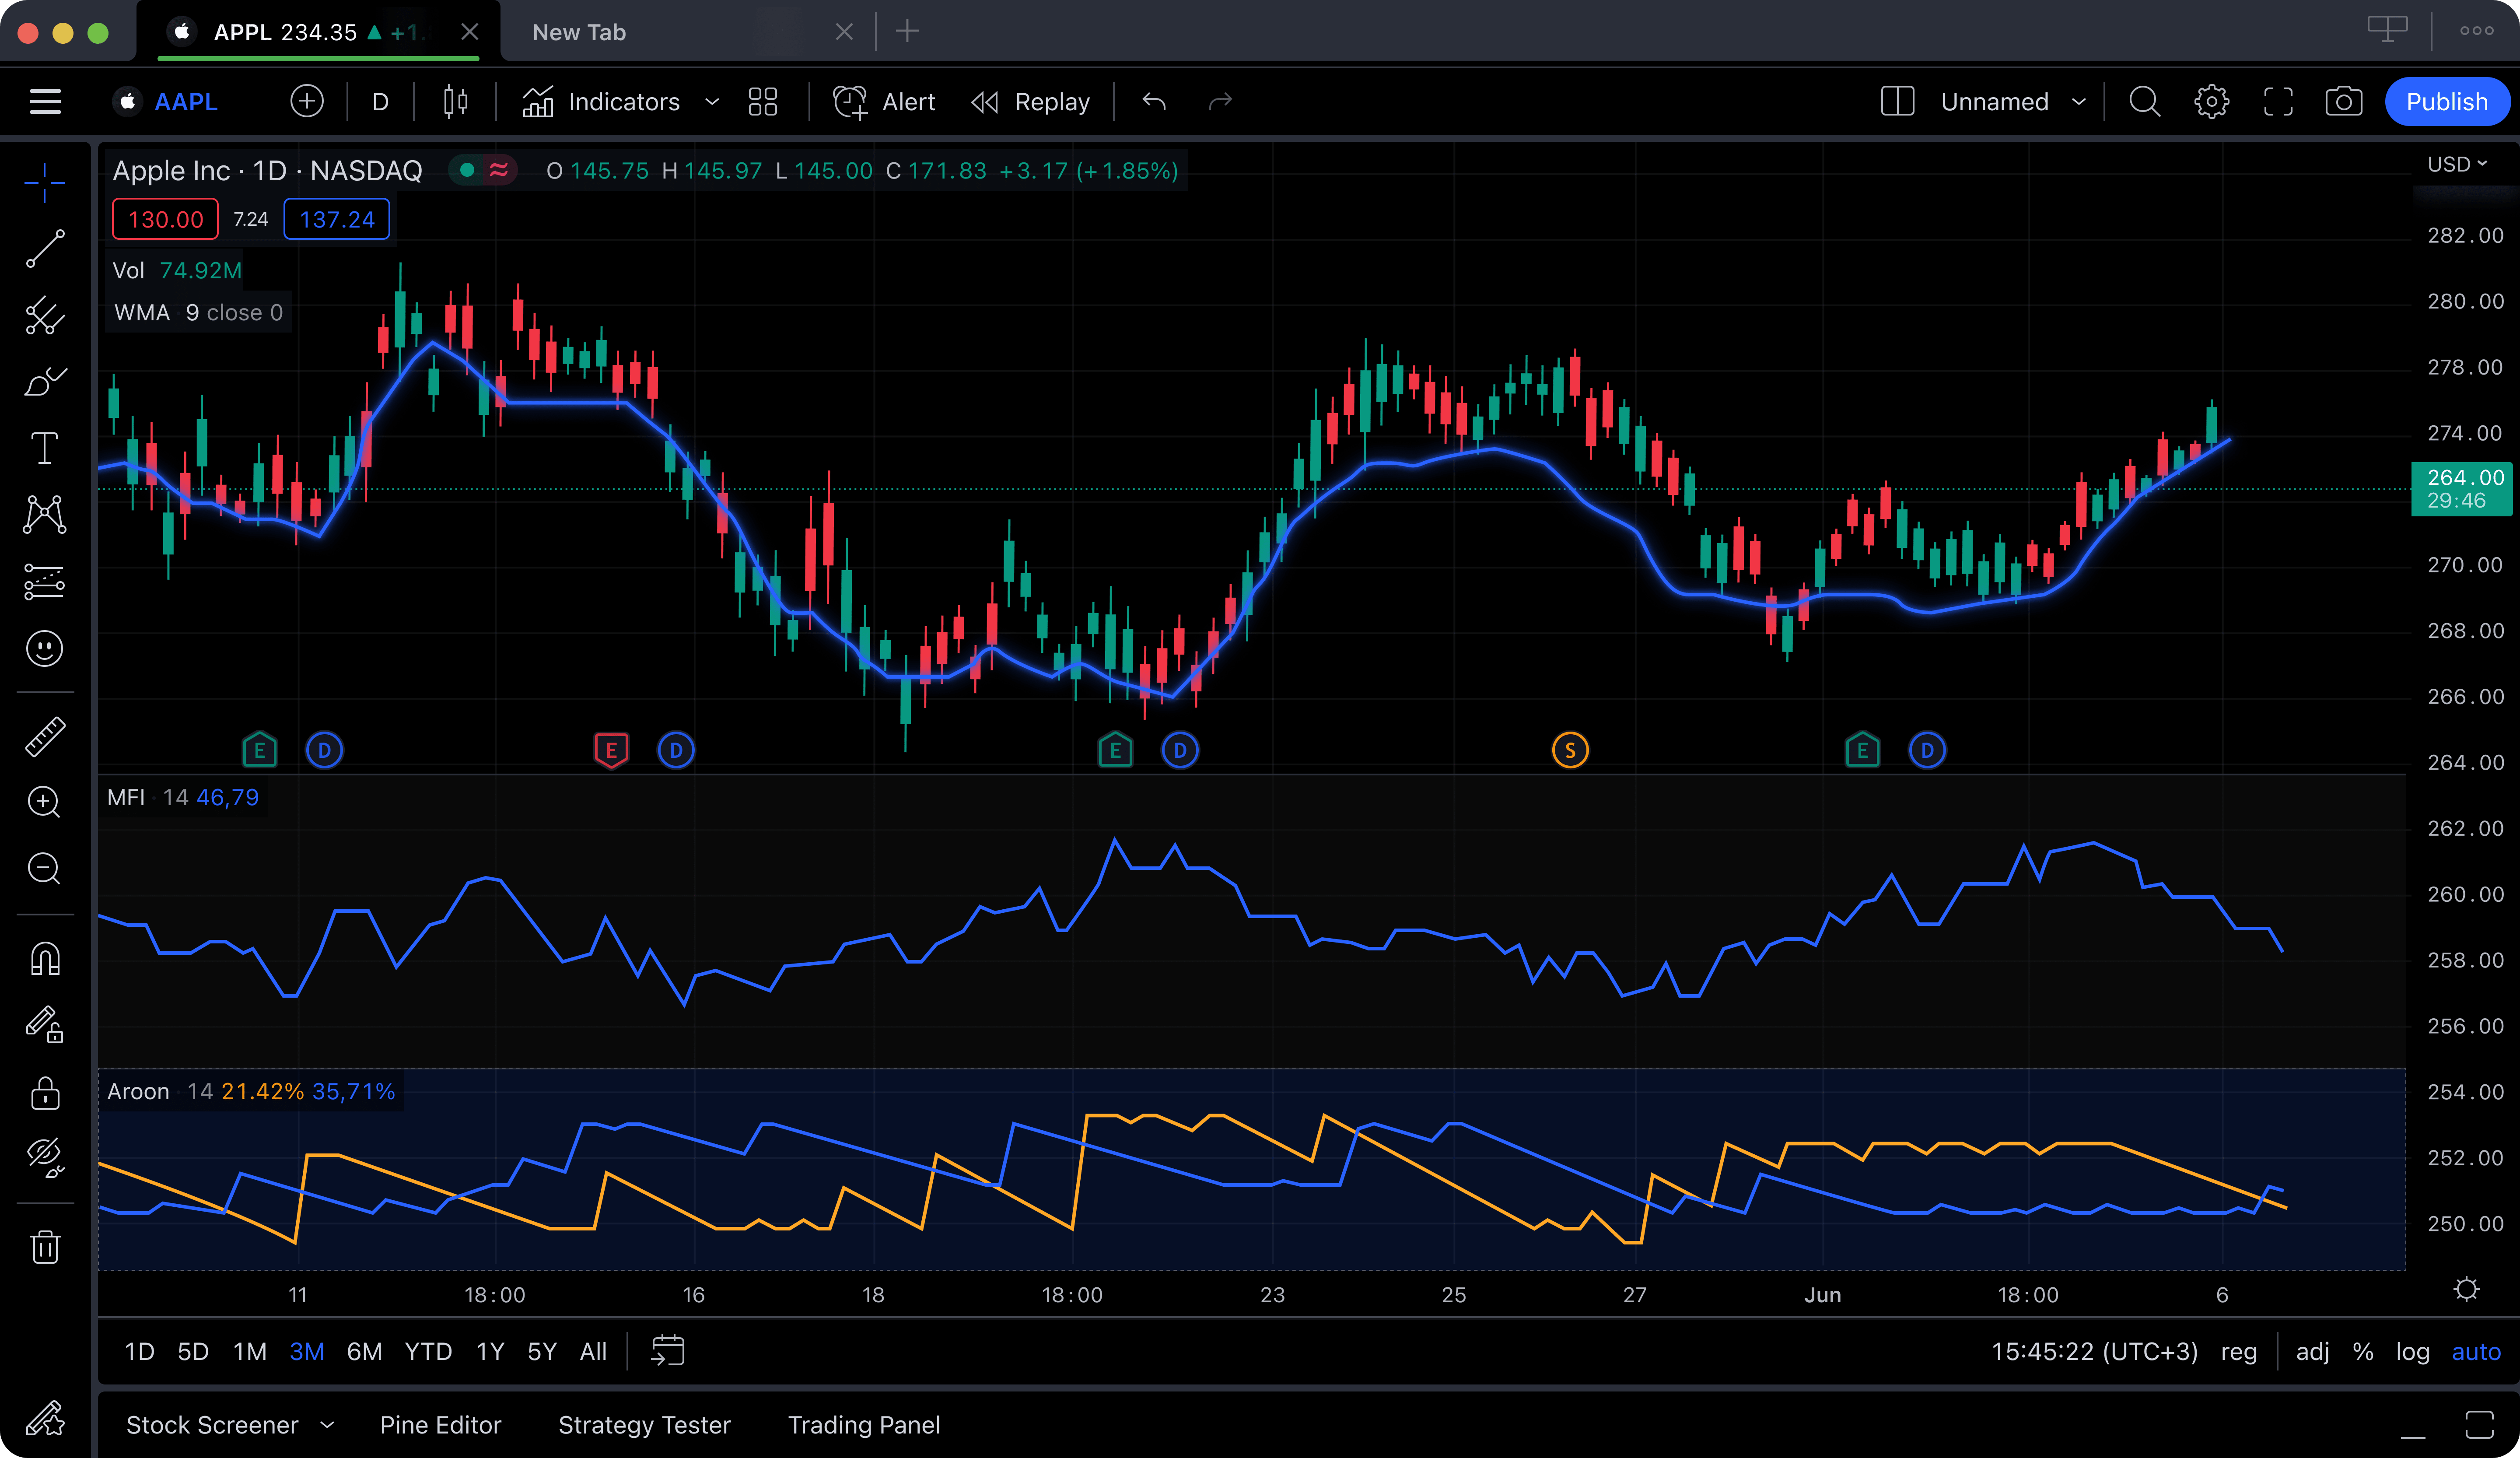
TradingView is arguably the most well-known name in online charting. It has earned a massive following thanks to its social features, which allow traders to share ideas, publish chart analyses, and follow each other's setups. The charting engine itself is polished and responsive, with an extensive library of indicators and a proprietary scripting language called Pine Script that lets advanced users build custom indicators and strategies.
The catch is that TradingView's free tier is quite restrictive. Free users can only apply a single indicator per chart, see persistent ads, are limited to one chart layout, and cannot set more than one price alert at a time. These limitations push most active traders toward a paid plan. The Essential plan starts at $14.95 per month (billed annually), and many users end up on the Plus or Premium tiers at $29.95 or $59.95 per month to unlock multiple indicators, ad-free charts, and additional layouts. That adds up quickly.
If the community aspect of trading is important to you, such as reading other traders' analyses, participating in discussions, and publishing your own ideas, TradingView is hard to beat. But if your priority is having a full set of charting tools without an aggressive paywall, you may find its free tier frustrating compared to alternatives that give you more out of the box.
Pros
- Large, active social trading community
- Pine Script for custom indicators
- Huge indicator library on paid tiers
- Covers stocks, crypto, forex, futures
Cons
- Free tier limited to 1 indicator per chart
- Ads on the free plan
- Paid plans are more expensive than most competitors
- No built-in AI analysis or insider data
3. Thinkorswim (Schwab)
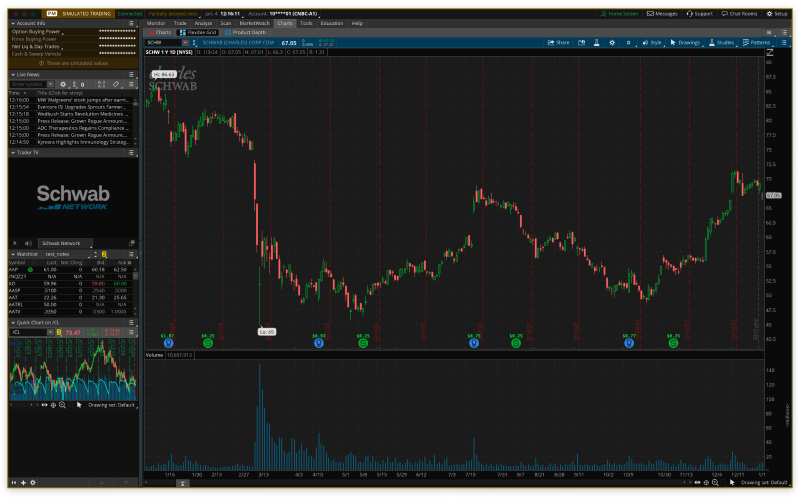
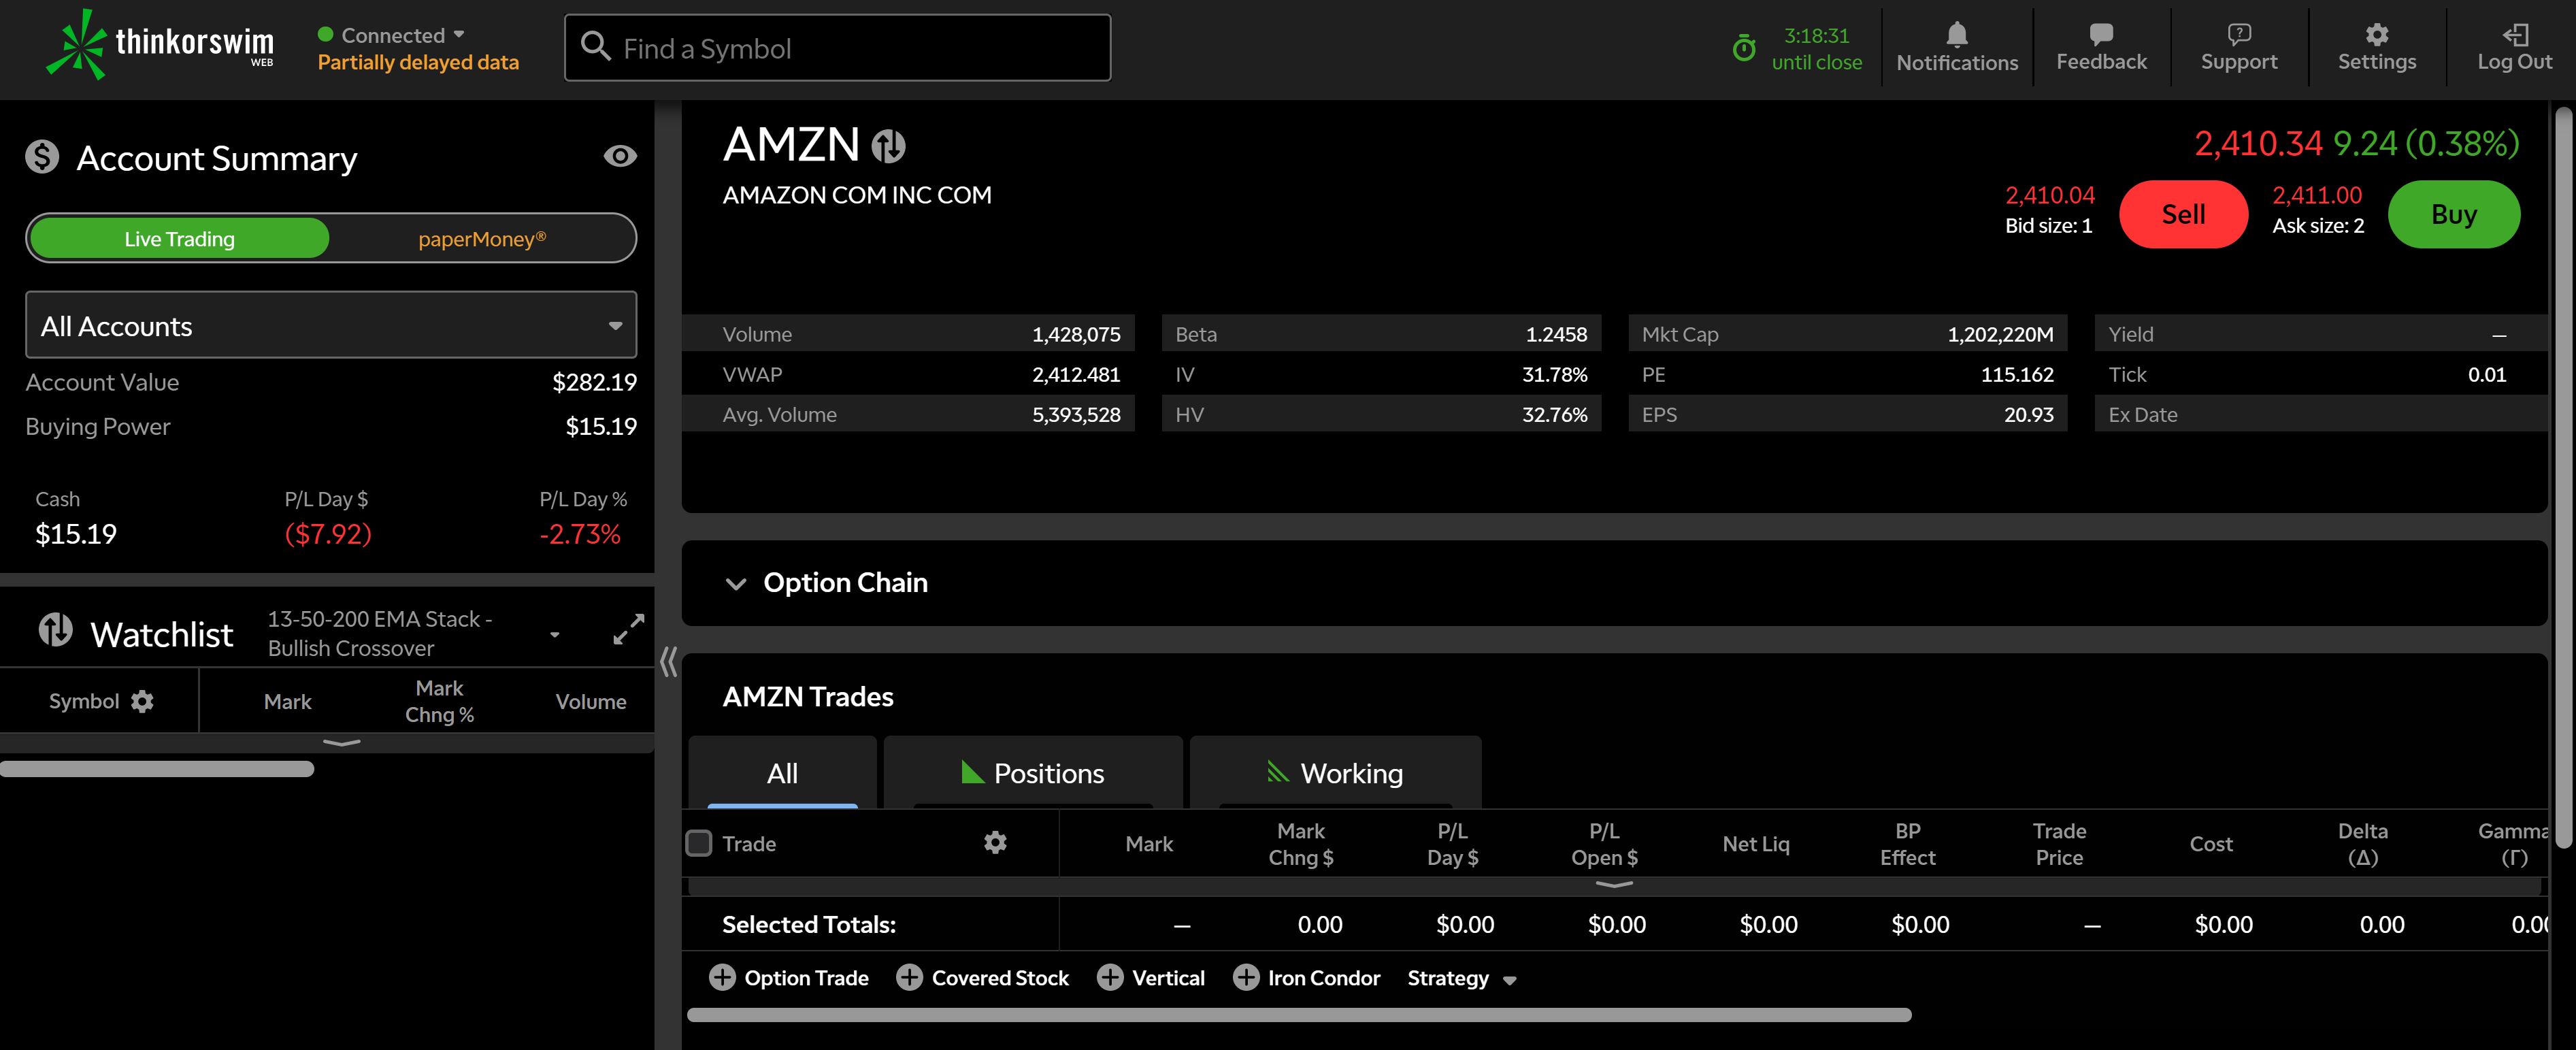
Thinkorswim, originally developed by TD Ameritrade and now part of Charles Schwab, is a heavyweight desktop charting platform. It offers a depth of features that rivals what institutional traders use: advanced options chains, probability analysis, a paper trading simulator with real-time data, and a wide selection of technical studies. For options traders especially, the ability to visualize Greeks, model spreads, and back-test strategies makes it a go-to choice.
The platform is technically free to use, but you need to open a Schwab brokerage account to access it. There is no standalone version. The desktop application is powerful but can feel dated and complex compared to modern web-based platforms. The learning curve is steep; new users often spend weeks learning to navigate the interface before they can chart efficiently. There is also a web version (thinkorswim Web), but it lacks many of the desktop version's advanced features.
If you are an active options trader who already has or is willing to open a Schwab account, Thinkorswim provides a level of options analysis that no other free platform matches. However, if you primarily trade stocks and want a fast, modern charting experience without the overhead of a brokerage relationship, there are simpler paths to get there.
Pros
- Advanced options analysis tools
- Paper trading with live data
- Extensive technical studies library
- Free with a Schwab brokerage account
Cons
- Requires a Schwab brokerage account
- Steep learning curve
- Desktop app feels dated
- No AI features or insider trading data
4. Webull
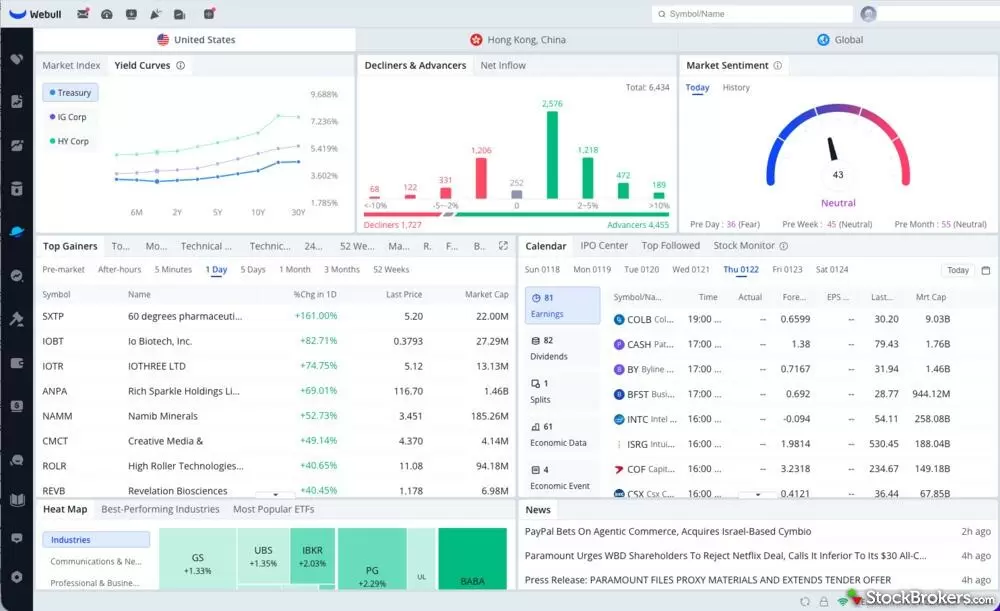
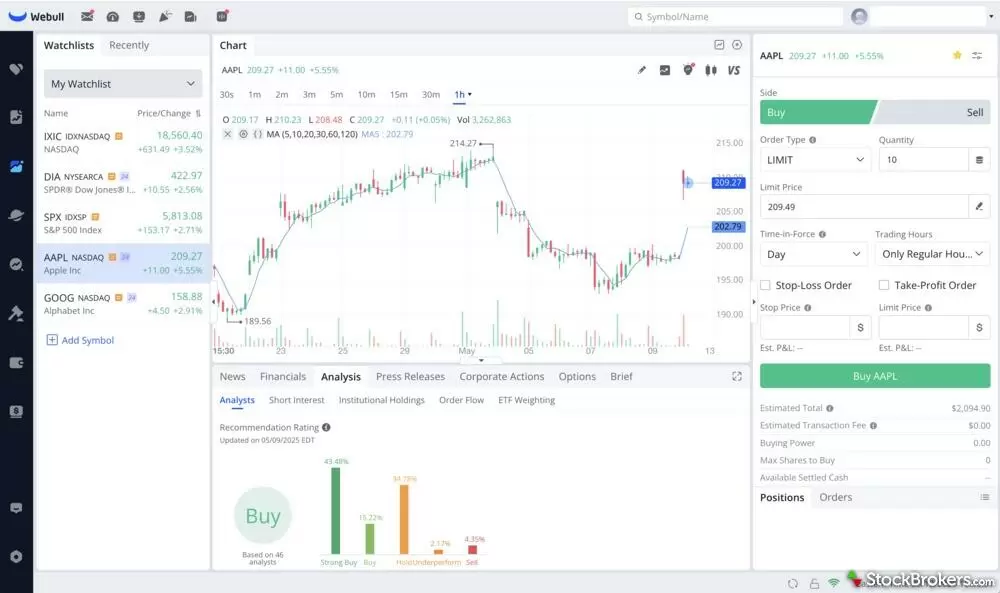
Webull carved out its niche as a mobile-first, commission-free trading platform aimed at younger and beginner investors. Its charting tools are built directly into the trading app, which makes it convenient for people who want to analyze a stock and place a trade without switching between platforms. The mobile charts include basic indicators like moving averages, MACD, RSI, and volume, and you can toggle between different time frames.
However, Webull's charting is clearly secondary to its trading function. The indicator selection is limited compared to dedicated charting platforms. Drawing tools are basic and can be cumbersome to use on a phone screen. The desktop version improves on this somewhat, but it still lacks the depth of platforms built primarily for technical analysis. There are no AI features, no scripting, and no insider trading data.
Webull works well if you are a beginner who wants to learn the basics of charting while also placing trades, all from your phone. But if you need more than half a dozen indicators or want to do serious multi-timeframe analysis, you will likely outgrow it quickly.
Pros
- Commission-free stock and ETF trading
- Clean, intuitive mobile app
- Free real-time market data
- Paper trading available
Cons
- Limited indicator selection
- Basic drawing tools
- No AI features, scripting, or insider data
- Charting is secondary to the brokerage function
5. Yahoo Finance
Yahoo Finance is one of the oldest and most widely recognized financial information websites. Millions of investors use it daily to check stock prices, read financial news, and track their portfolios. The built-in charting tool lets you view price history, overlay a few basic indicators, and compare multiple tickers on the same chart. It is simple and accessible, requiring no account to use.
As a charting platform, though, Yahoo Finance is limited. The technical analysis tools are minimal: you get a handful of overlays (moving averages, Bollinger Bands) and a few studies (RSI, MACD), but there are no drawing tools like trendlines or Fibonacci retracements. Chart interactivity is basic, and you cannot save layouts. The premium tier (Yahoo Finance Plus) at $24.99 per month adds research tools and data, but does not meaningfully improve the charting experience itself.
Yahoo Finance is best thought of as a quick-glance tool. If you want to check what a stock did today, read a headline, or see a basic price chart, it does that well. But if you are performing any kind of regular technical analysis, you will need a dedicated charting platform.
Pros
- No account required for basic use
- Excellent financial news coverage
- Portfolio tracking
- Widely recognized and trusted brand
Cons
- Very limited technical analysis tools
- No drawing tools (trendlines, Fibonacci)
- Cannot save chart layouts
- No AI features, no insider data
- Heavy advertising
6. StockCharts
StockCharts has been a staple of the technical analysis community for over two decades. The platform is known for its educational content, including the ChartSchool resource that teaches technical analysis concepts from the ground up. It supports a solid range of technical indicators, scan tools, and chart types including point-and-figure and Renko charts that some newer platforms overlook.
The free tier of StockCharts gives you access to basic charting with delayed data. You can view charts and apply some indicators, but features like real-time data, advanced scanning, saved chart lists, and custom alerts require a paid plan starting at $24.95 per month. That is notably more expensive than several competitors offering more features at a lower price. The interface, while functional, has not kept pace with the modern, sleek designs of newer charting tools.
StockCharts is a good option for traders who are deeply focused on classical technical analysis and value the educational resources that come with the platform. If you want to learn about chart patterns, indicator theory, and traditional TA methodology, StockCharts' educational ecosystem is among the best. But as a day-to-day charting tool, the high price and dated interface may push you toward more modern alternatives.
Pros
- Excellent technical analysis education (ChartSchool)
- Supports niche chart types (P&F, Renko)
- Solid scanning and alert tools on paid plans
- Long-standing reputation in TA community
Cons
- Free tier has delayed data only
- Paid plans start at $24.95/mo, one of the most expensive
- Interface feels dated
- No AI features, no insider data, no social tools
7. Trading212
Trading212 is a commission-free trading platform popular in the UK and across Europe. It gained traction by offering fractional shares, ISA (tax-advantaged) accounts, and a practice mode that lets users trade with virtual money. The platform covers stocks, ETFs, forex, and commodities, and its clean mobile app makes it straightforward for beginners to get started with investing.
The charting tools within Trading212 are functional but basic. You get standard candlestick and line charts, a modest selection of indicators (moving averages, RSI, MACD, Stochastic), and simple drawing tools. The charts work for checking a quick setup before placing a trade, but they are not designed for deep technical analysis sessions. There is no scripting, no advanced scanning, and no AI-driven features. The platform also does not provide insider trading data or institutional flow information.
Trading212 is a solid choice if you are based in the UK or EU and want a simple, no-cost way to invest and check basic charts. Its ISA wrapper for UK investors is a genuine differentiator. But for dedicated charting and technical analysis, most traders will want to pair Trading212's brokerage with a separate, more capable charting platform.
Pros
- Commission-free trading in UK/EU
- ISA accounts for UK tax advantages
- Fractional shares available
- Clean mobile experience
Cons
- Basic charting tools
- Limited indicator selection
- No AI features, no insider data, no scripting
- Not available in all countries
Side-by-Side Comparison Table
Here is how all seven platforms stack up across the features that matter most when choosing free stock charting software.