10 Best StockCharts Alternatives in 2026 (Free & Paid)
By ChartingLens TeamUpdated May 8, 202620 min read
📅 May 2026 Update
ChartingLens just launched a new tier structure — Premium at $14.99/mo with sensible quotas (20 alerts, 10 layouts, 20 AI credits/day) and Pro at $29.99/mo with unlimited everything. The Free tier is unchanged: real-time stocks, crypto, forex & metals, all chart types, all drawing tools, cloud sync, and insider data. Yearly plans save 17%. Compare all plans →
StockCharts.com has been a household name in technical analysis since the early 2000s. Its predefined scans, Point & Figure charts, and market breadth indicators helped a generation of traders learn chart-based analysis. But in 2026, StockCharts is showing its age. A growing number of traders are actively searching for the best StockCharts alternative — and for good reason.
The most immediate problem is pricing relative to value. StockCharts charges $24.95 per month for its Basic plan and $39.95 per month for the Extra plan. For that money, you get charting that still feels rooted in the early web era. The free tier offers only delayed data with limited chart interactivity — you cannot even get real-time quotes without paying. Compare that to modern platforms that offer real-time data, AI-powered analysis, and interactive charting on their free tiers, and StockCharts starts to look like a relic.
The interface is the second major issue. While StockCharts introduced its Advanced Charting Platform (ACP) to modernize the experience, it still lacks the fluid interactivity traders expect in 2026. Drawing tools are limited, multi-chart layouts are basic, and the overall user experience feels a generation behind platforms like TradingView or ChartingLens. Many traders report that StockCharts feels like using a tool built for 2010 in a 2026 market.
Third, and perhaps most critically, StockCharts has no AI features whatsoever. No AI buy/sell signals, no AI trading assistant, no automated chart pattern recognition, no AI-powered backtesting. In a year where AI is transforming how retail traders analyze markets (see our AI-assisted trading guide), StockCharts offers the same manual workflow it has provided for over a decade. You are paying more and getting less than what modern platforms deliver for free.
This guide reviews 10 platforms that serve as genuine StockCharts alternatives in 2026. Whether you are frustrated by the outdated interface, tired of paying $25 or more per month for basic charting, or want AI-driven analysis tools that StockCharts simply does not offer, you will find the right fit here.
Quick Comparison: All 10 StockCharts Alternatives
Here is how all 10 platforms compare across the features that matter most when replacing StockCharts.
Scroll horizontally to see all columns →
Platform
Free Tier
AI Features
Indicators
Screener
Drawing Tools
Premium Cost
ChartingLens
✓ Full features
✓ AI signals, assistant, patterns
15+ free
✓ With CL Score
✓ Full suite
$14.99/mo
TradingView
Limited (1 indicator)
✗
400+ (paid)
✓
✓ Extensive
$14.95–$59.95/mo
Finviz
✓ Screener + maps
✗
~15
✓ Best-in-class
✗ Minimal
$39.99/mo
TC2000
Limited
✗
70+
✓ EasyScan
✓ Solid
$14.99–$89.98/mo
TrendSpider
✗
✓ Auto trendlines
100+
✓
✓ Advanced
$22–$79/mo
Thinkorswim
✓ With Schwab acct
✗
300+
✓
✓ Professional
Free
Koyfin
✓ Limited
✗
~30
✓
Basic
$25–$65/mo
Barchart
✓
✗
150+
✓
Basic
$19.99–$59.97/mo
Yahoo Finance
✓ Full access
✗
~20
Basic
Basic
$24.99/mo
Webull
✓ With trading
✗
~20
Basic
Basic
Free
In-Depth Reviews of All 10 StockCharts Alternatives
1. ChartingLens — Best Overall StockCharts Alternative
ChartingLensFree + $14.99/mo Premium
ChartingLens is the most complete StockCharts replacement available in 2026, particularly for traders who want modern AI-powered analysis without paying a premium for basic charting features. Where StockCharts charges $24.95 per month for its Basic plan with limited interactivity, ChartingLens delivers a fully interactive, web-based charting experience with AI analysis on its free tier. No download, no brokerage account, no ads.
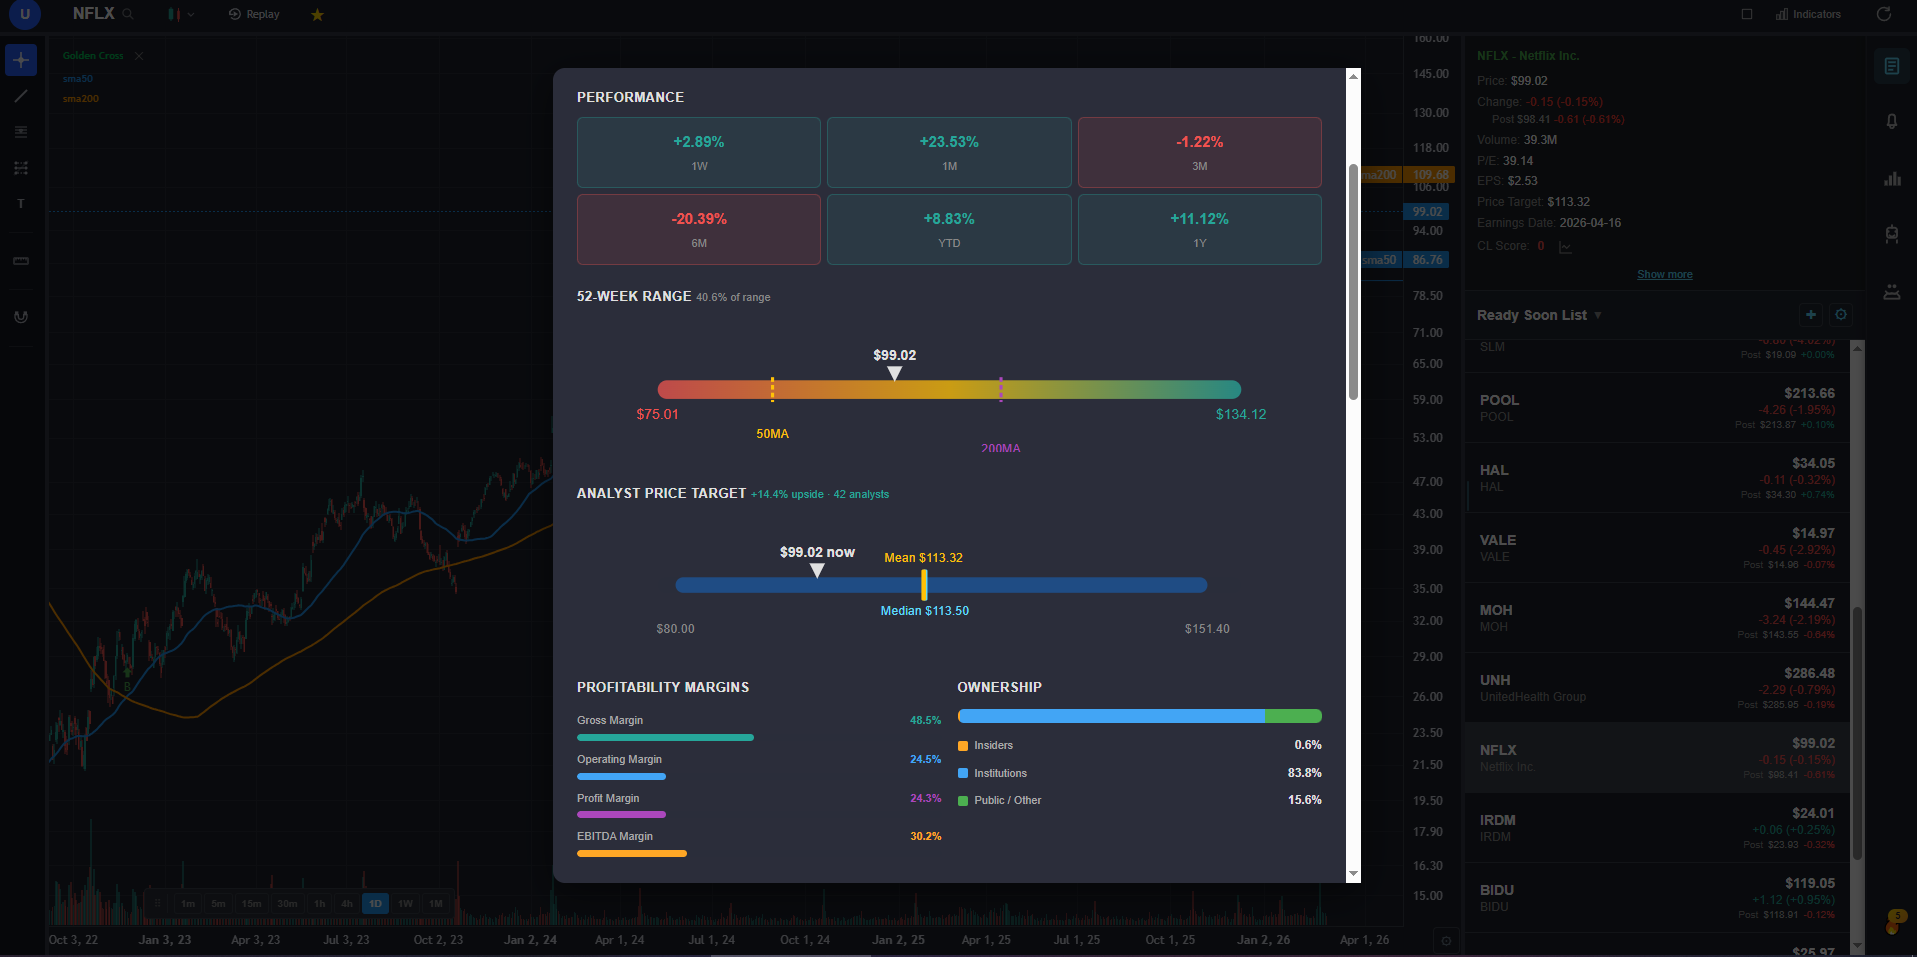
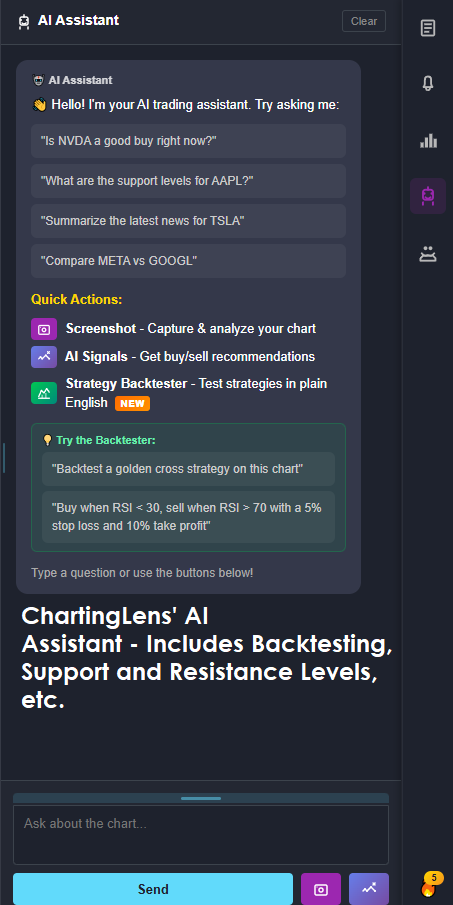
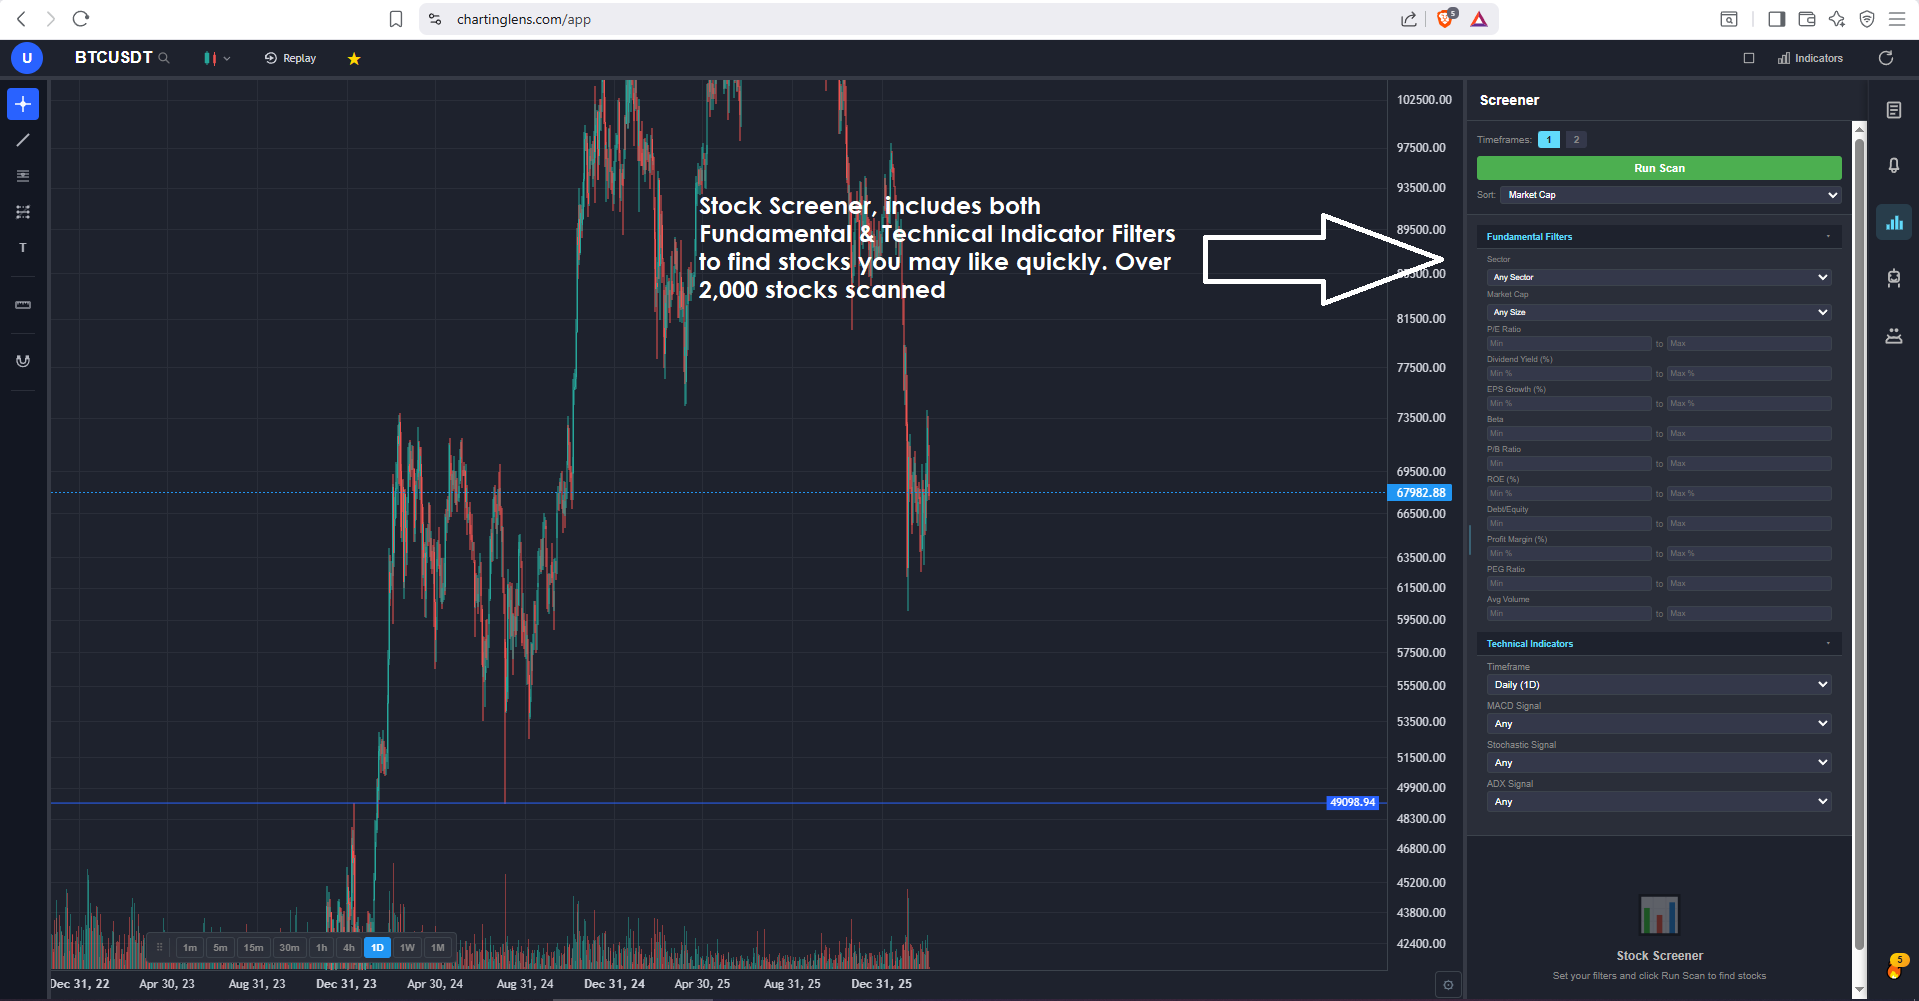
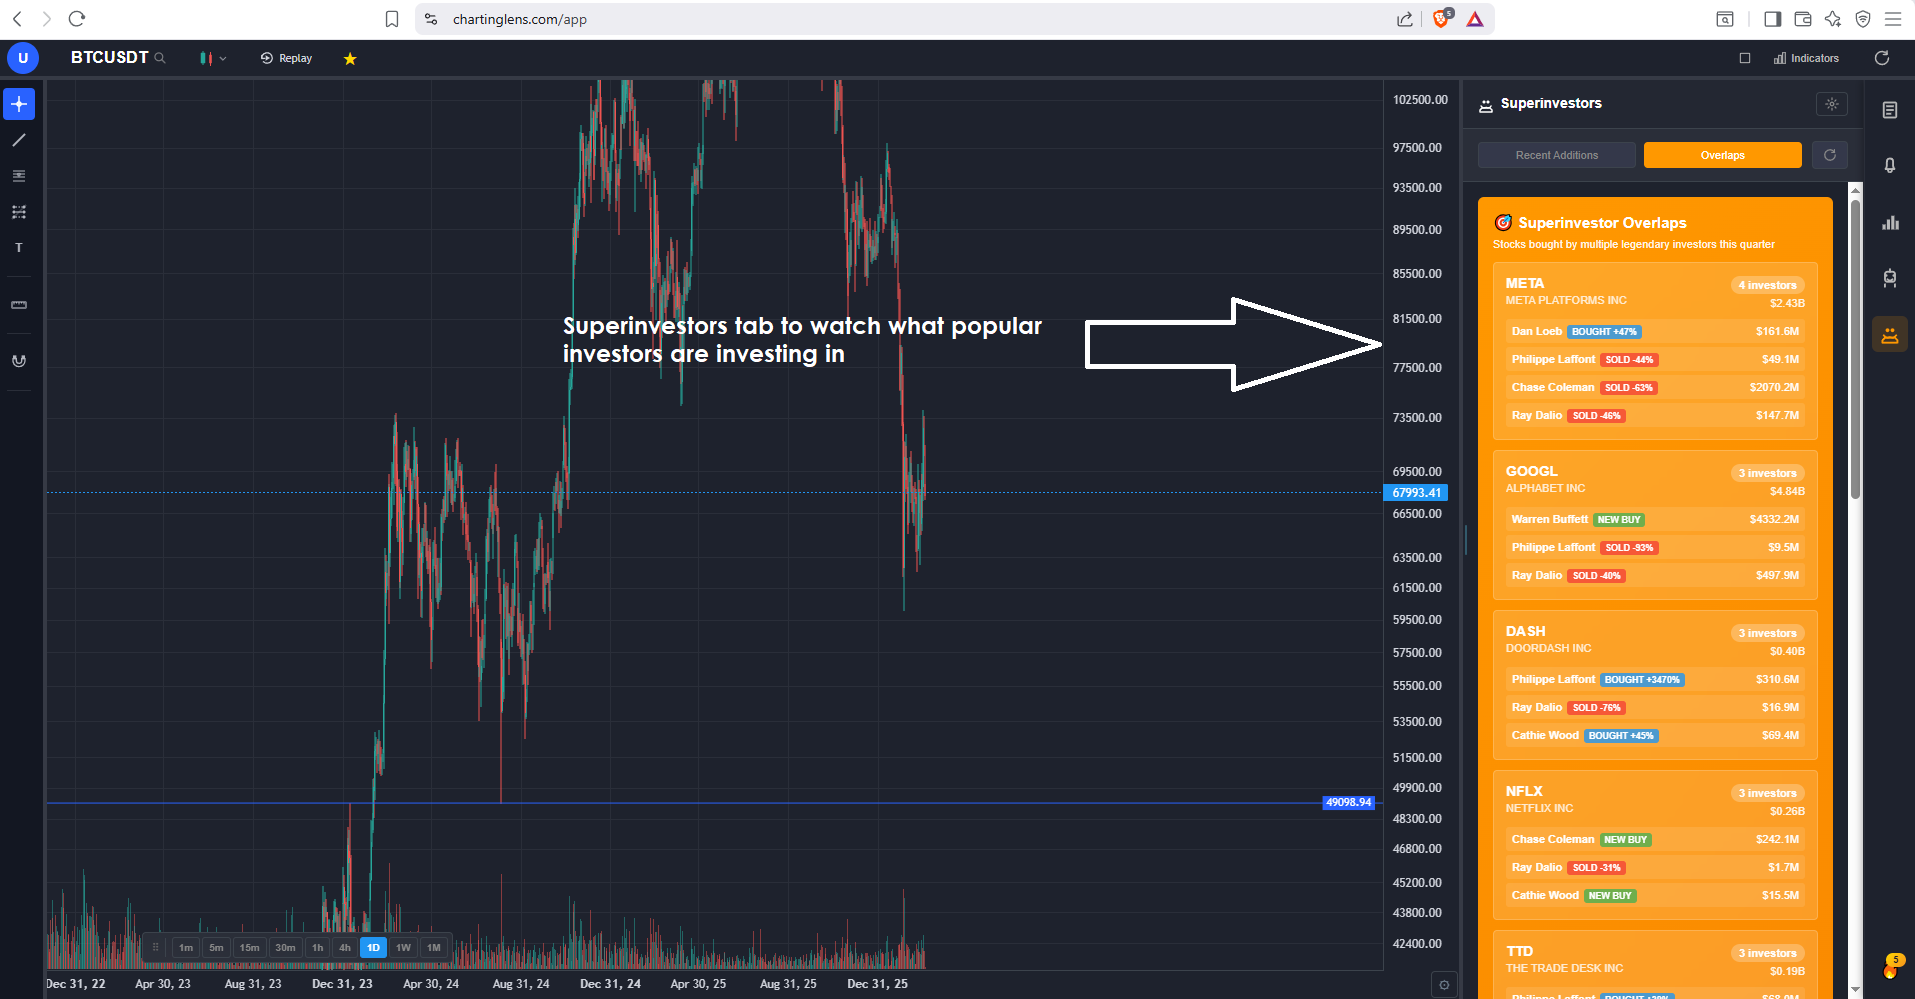
The free tier alone surpasses what StockCharts offers on any plan. You get 40+ technical indicators with no per-chart limit, real-time stock and crypto charts, AI buy/sell signals scanning 2,000+ stocks daily, an AI trading assistant that draws support and resistance levels directly on your chart, automated chart pattern recognition for 13+ patterns, a plain-English strategy backtester, insider trading data, hedge fund holdings (Warren Buffett, Michael Burry, and more), a stock screener with CL Score ranking, bar replay with paper trading, multi-chart layouts, and zero ads on any tier.
Premium at $14.99 per month adds Volume Profile (VRVP) with auto-updating Point of Control and Value Area lines, unlimited custom backtesting strategies with shorting and time filters, expanded AI analysis, trendline alerts, and extended historical data. For context, StockCharts charges $24.95 per month for basic charting without any of these AI features. You are paying less than half the price for dramatically more functionality.
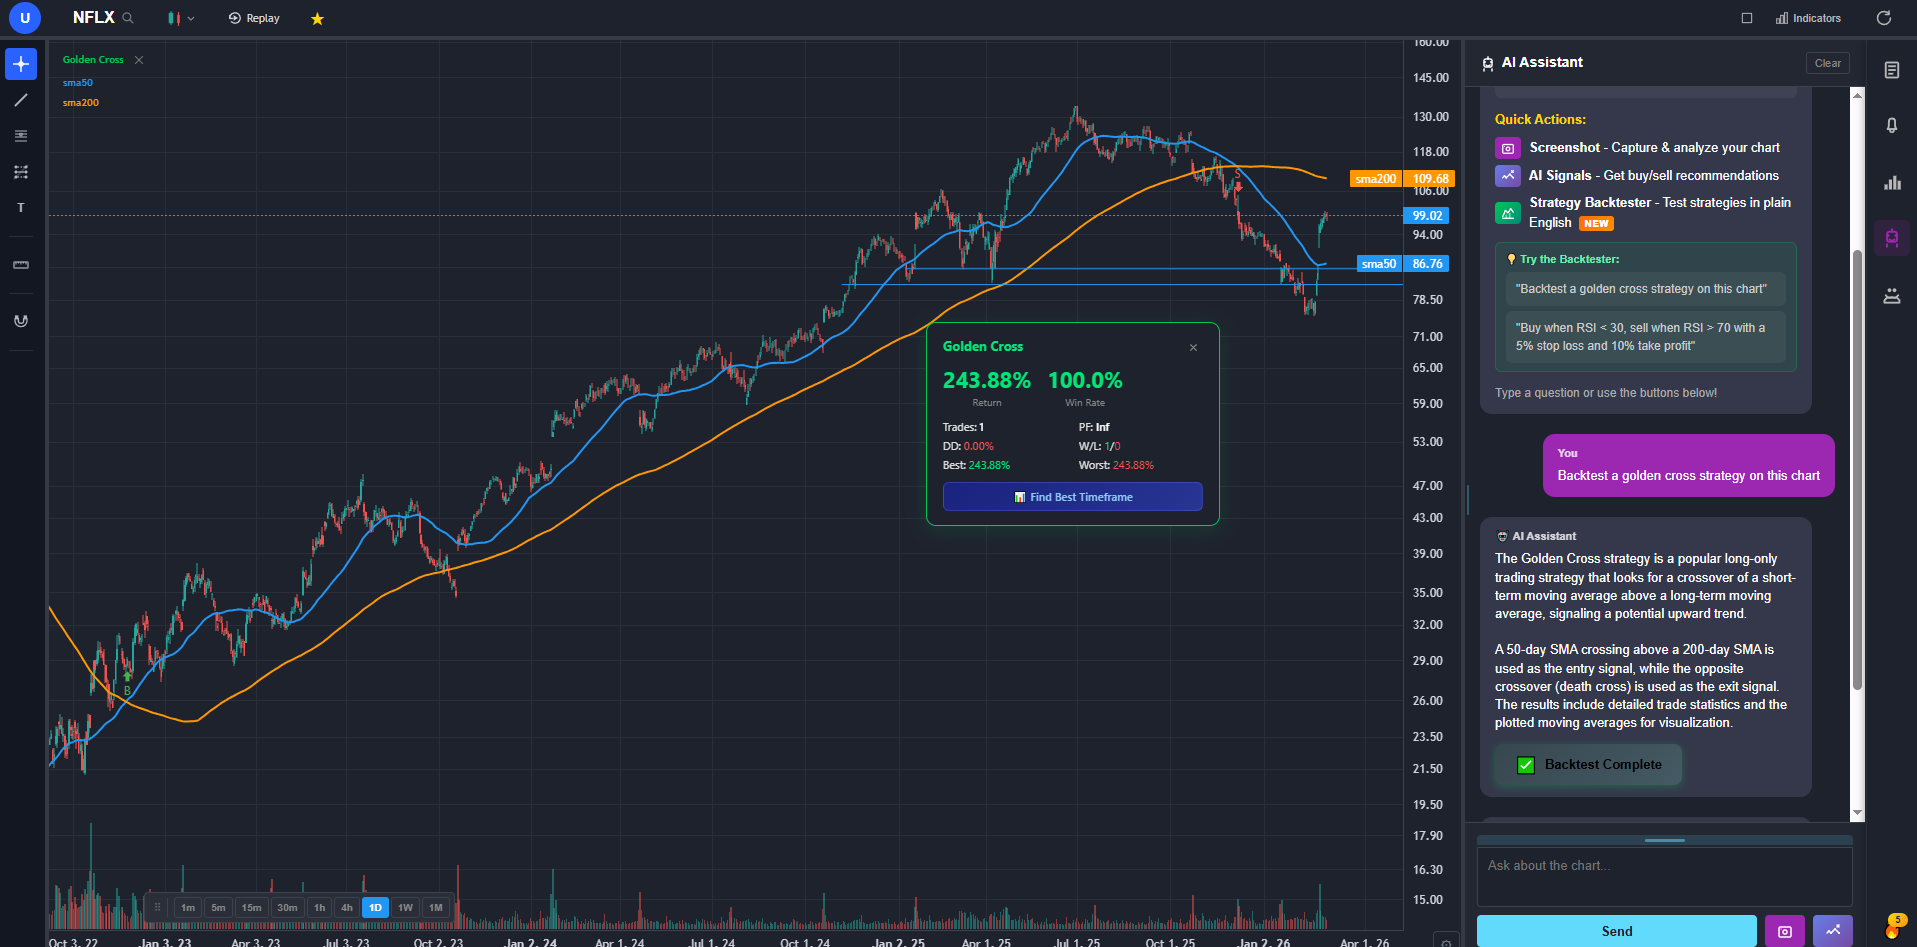
The AI capabilities are where ChartingLens truly separates from StockCharts. StockCharts relies entirely on manual analysis — you draw your own trendlines, run your own scans, and interpret patterns yourself. ChartingLens automates all of that. The AI assistant is conversational — ask it anything about a stock and it responds with actionable analysis. The plain-English backtester means you describe a strategy in normal language instead of learning a scripting language — see our guide on how to backtest a trading strategy. And AI-generated custom indicators let you ask for any indicator and apply it to your chart instantly, no coding required.
Pros
40+ indicators free, unlimited per chart
AI buy/sell signals scanning 2,000+ stocks daily
AI trading assistant draws S&R on your chart
Plain-English strategy backtester (no coding needed)
AI-generated custom indicators
Volume Profile (VRVP) on Premium at $14.99/mo
Auto chart pattern recognition (13+ patterns)
Real-time insider trading data
Hedge Fund Holdings
Bar replay with paper trading and live P&L
Multi-chart layouts (up to 3 charts, 8 arrangements)
Stock screener with CL Score ranking
Web-based — no download, works on any device
No ads on any tier
$14.99/mo vs StockCharts $24.95–$39.95/mo
Custom timeframes (NEW) — chart any interval (2h, 45m, 3d, 8h…) aggregated from base bars on the fly. Premium feature, added April 2026.
Cons
No direct broker execution or order routing
No options chain or options analytics
No futures or forex coverage
Newer platform, smaller community than StockCharts
No Point & Figure or Renko chart types
Best for: Traders who want the most complete analysis platform with AI-powered signals, pattern recognition, insider data, and backtesting — all at a fraction of StockCharts pricing with no ads and a modern interface.
2. TradingView — Best for Community & Pine Script
TradingView$0–$59.95/mo
TradingView is the most popular web-based charting platform globally, with a massive community of traders sharing ideas, indicators, and strategies. Its Pine Script language allows you to build custom indicators and automated strategies — something StockCharts never offered. The indicator library is enormous, with hundreds of built-in studies and thousands of community-created scripts. If you relied on StockCharts for technical analysis education and community engagement, TradingView's social features are a significant upgrade.
The main drawback is pricing. The free tier limits you to 1 indicator per chart, 1 alert, and displays persistent ads. Most StockCharts users will need at least the Plus plan at $29.95 per month to get 5 indicators per chart and 100 alerts — making it more expensive than StockCharts for comparable daily use. TradingView also lacks native AI features — no AI signals, no AI assistant, and no automated pattern recognition.
Where TradingView excels over StockCharts is in chart interactivity, drawing tools, and multi-asset coverage. The charting experience is modern and fluid, with extensive drawing tools, multiple chart types including Point & Figure, and coverage across stocks, crypto, forex, and futures. For traders who found StockCharts' ACP limiting, TradingView is a clear step up in terms of interface quality.
Best for: Traders who prioritize community, social trading ideas, and need Pine Script for custom indicator development as an upgrade from StockCharts' static charting.
3. Finviz — Best for Screening & Heat Maps
Finviz$0–$39.99/mo
Finviz is one of the best-known stock screeners on the web, and for StockCharts users who relied heavily on predefined scans and sector analysis, Finviz is a natural alternative. The free screener lets you filter stocks by dozens of fundamental and technical criteria, and the signature heat maps provide an instant visual overview of market performance by sector, industry, or custom grouping.
Where Finviz falls short is in charting depth. The charts are static images on the free tier — you cannot interact with them, add multiple indicators, or draw trendlines. The Elite plan at $39.99 per month adds real-time data, advanced charts, and backtesting, but even then the charting experience is basic compared to dedicated charting platforms. Finviz is best viewed as a screening and research tool, not a full StockCharts replacement for chart-heavy workflows.
The snapshot feature is genuinely useful — it gives you a quick overview of any stock with key fundamentals, technical signals, analyst ratings, and insider trading activity on a single page. For traders who used StockCharts primarily for quick stock lookups and scan results rather than in-depth charting, Finviz delivers comparable value at a similar or lower price point.
Pros
Best-in-class stock screener with dozens of filters
Signature heat maps for market overview
Stock snapshot pages with key data at a glance
Free tier is powerful for screening
Insider trading data on snapshots
Sector and industry analysis
Cons
Charts are static images on free tier
Very limited drawing tools even on Elite
No AI features
No real-time data on free tier
No backtesting on free tier
$39.99/mo for Elite is expensive for what you get
Best for: Traders who primarily used StockCharts for predefined scans and sector analysis and want a more powerful screening tool with visual heat maps.
4. TC2000 — Best for Condition-Based Scanning
TC2000$14.99–$89.98/mo
TC2000 has been a favorite among technical analysts for decades, and its EasyScan language gives traders a powerful way to build custom scans with condition-based logic. If your primary use of StockCharts was running predefined scans and then charting the results, TC2000 is a strong replacement. The scan engine is fast, the condition builder is intuitive, and the charting is solid with 70+ indicators and proper drawing tools.
The key advantage TC2000 has over StockCharts is the depth of its scanning capabilities. Where StockCharts offers predefined scan lists, TC2000 lets you build complex multi-condition scans from scratch using its EasyScan language. You can combine technical conditions, fundamental filters, and price action criteria in ways that StockCharts simply cannot match. The charting is also more interactive, with a cleaner interface and better drawing tools.
The downside is pricing — the full feature set requires the Platinum plan at $89.98 per month, which is significantly more expensive than StockCharts. The Silver plan at $14.99 is quite limited. TC2000 also has no AI features, no insider data, and no crypto coverage.
Pros
Powerful EasyScan condition-based screener
Fast scan engine with real-time alerts
70+ built-in indicators
Solid charting with drawing tools
Integrated broker for stocks and options
Better interactivity than StockCharts ACP
Cons
Full features require $89.98/mo Platinum plan
Silver plan at $14.99/mo is very limited
No AI features
No crypto support
No insider data or hedge fund holdings
Best for: Technical analysts who relied on StockCharts scans and want a more powerful, customizable screening engine with condition-based logic.
5. TrendSpider — Best for Automated Technical Analysis
TrendSpider$22–$79/mo
TrendSpider brings automation to technical analysis with features like auto-detected trendlines, multi-timeframe analysis overlays, and automated alerts based on technical conditions. For StockCharts users who spent hours manually drawing trendlines, identifying patterns, and checking multiple timeframes, TrendSpider can save significant time by automating the tedious parts of chart analysis.
The platform excels at tasks that StockCharts requires you to do manually. Trendlines are drawn automatically across multiple timeframes. Fibonacci levels are auto-calculated. Candlestick patterns are flagged in real time. The Raindrop chart type is a proprietary innovation that combines price action with volume data in a unique visual format that some traders find more readable than traditional candlesticks.
The trade-off is cost and complexity. The entry price of $22 per month gets you limited features, and the full Elite plan runs $79 per month. There is no free tier at all. The platform has a learning curve, and while the automation is powerful, it does not include AI buy/sell signals or an AI trading assistant like ChartingLens offers.
Pros
Automated trendline detection
Multi-timeframe analysis on one chart
Smart alerts with technical conditions
Raindrop charts (proprietary chart type)
Backtesting with coded strategies
Auto Fibonacci and pattern detection
Cons
No free tier
$22–$79/mo is expensive for charting
Steep learning curve
No AI buy/sell signals or AI assistant
No insider data or hedge fund holdings
Best for: Technical analysts who want automated trendline detection and multi-timeframe analysis to replace the manual charting workflow that StockCharts requires.
6. Thinkorswim — Best Free Broker-Integrated Charting
Thinkorswim (by Schwab)Free with Schwab account
Thinkorswim is a professional-grade desktop charting and trading platform available for free with a Charles Schwab brokerage account. For StockCharts users who want a dramatic upgrade in charting depth without paying a monthly subscription, thinkorswim offers 300+ indicators, thinkScript custom scripting, deep options analytics, and professional-level drawing tools — all at no additional cost beyond the brokerage account.
The charting capabilities far exceed what StockCharts offers at any price tier. You get multi-timeframe analysis, custom workspaces, advanced studies, and the thinkScript language for building your own indicators and scans. The options analysis tools — probability cones, risk profiles, Greeks — are features that StockCharts does not offer at all. If you trade options alongside stocks, thinkorswim is in a different league.
The downsides are significant for some users. Thinkorswim is primarily a desktop application — the web version is stripped down. You need a Schwab brokerage account to access it. The learning curve is steep. And there are no AI features — no AI signals, no AI assistant, no automated pattern recognition. It is a powerful but traditional platform that requires manual analysis.
Pros
300+ indicators — far more than StockCharts
thinkScript custom scripting language
Professional options analytics
Free with Schwab brokerage account
Deep backtesting and strategy testing
Multi-asset: stocks, options, futures, forex
Paper trading with simulated execution
Cons
Requires Schwab brokerage account
Desktop-heavy — web version is limited
Steep learning curve
No AI features
Resource-intensive application
Schwab transition has caused workflow disruptions
Best for: Traders who want the deepest free charting platform available and are willing to use a desktop application with a Schwab brokerage account.
7. Koyfin — Best for Fundamental Analysis
Koyfin$0–$65/mo
Koyfin offers a Bloomberg-style terminal experience at a fraction of the cost. Its strength is in fundamental analysis — customizable dashboards with financial statements, valuation metrics, earnings data, and economic indicators. For StockCharts users who relied on the fundamental overlays and sector rotation analysis, Koyfin provides a more comprehensive fundamental research environment with better data visualization.
The charting module includes around 30 technical indicators and basic drawing tools. While this is fewer indicators than StockCharts offers, the presentation is cleaner and the fundamental data integration is seamless. You can overlay earnings, revenue, and margins directly onto price charts in ways that StockCharts cannot match. The macro dashboard and economic data tools are excellent for traders who analyze broader market conditions.
The free tier has significant limitations including delayed data and restricted dashboard customization. The Plus plan at $25 per month and the Pro plan at $65 per month unlock real-time data, additional screeners, and expanded export capabilities. For purely technical traders, Koyfin is not the right choice. But for fundamentally-oriented traders who found StockCharts lacking in financial data depth, Koyfin is a compelling upgrade.
Pros
Bloomberg-style dashboards and fundamentals
Comprehensive financial data and ratios
Fundamental overlays on price charts
Customizable watchlists and screeners
Economic calendar and earnings data
Free tier available
Cons
Charting is secondary, not as deep as TA platforms
Delayed data on free tier
No AI features
No broker integration
~30 indicators (fewer than StockCharts)
Best for: Fundamental analysts and investors who want a Bloomberg-style research terminal with deeper financial data than StockCharts offers.
8. Barchart — Best for Data Coverage
Barchart$0–$59.97/mo
Barchart is the closest direct competitor to StockCharts in terms of content and approach. Both platforms offer web-based charting with market commentary, data pages, and screeners covering multiple asset classes. Barchart covers stocks, ETFs, futures, forex, options, and indices with 150+ technical indicators — more than StockCharts offers. It also provides Point & Figure charts and market breadth data that StockCharts users rely on.
The free tier is generous with real-time data and basic charting. Premium tiers add options flow data, advanced screeners, additional chart types, and API access. The opinion system — which rates each stock as a buy, sell, or hold based on technical indicators — provides a quick consensus view similar to StockCharts' technical alerts but with more granularity.
The interface is functional but, like StockCharts, it feels dated compared to modern web platforms. There are no AI features, and the charting interactivity, while adequate, does not match the fluid experience of TradingView or ChartingLens. For traders who want a platform that feels familiar to StockCharts but offers more data and better coverage, Barchart is the most natural transition.
Pros
150+ indicators across all major asset classes
Point & Figure charts available
Market breadth data like StockCharts
Free real-time data
Options flow data on premium
Opinion rating system for quick analysis
Comprehensive market data pages
Cons
Dated interface design
No AI features
No broker integration
No custom scripting
Limited drawing tools
Premium is $59.97/mo for full access
Best for: Traders who want the most similar experience to StockCharts with broader data coverage, more indicators, and market breadth tools.
9. Yahoo Finance — Best Completely Free Option
Yahoo FinanceFree + $24.99/mo Plus
Yahoo Finance is the most widely used free financial data platform in the world. For StockCharts users who primarily used the free tier for basic charting, stock quotes, and news, Yahoo Finance delivers comparable functionality at no cost. You get real-time quotes, interactive charts with about 20 technical indicators, portfolio tracking, financial news, and earnings calendars — all for free with no account required.
Yahoo Finance Plus at $24.99 per month adds enhanced charting, research reports from Morningstar and Argus, technical pattern recognition, advanced portfolio analytics, and fair value estimates. At the same price point as StockCharts Basic, Yahoo Finance Plus offers a broader range of features including the research reports and portfolio tools that StockCharts lacks.
The charting is basic compared to dedicated charting platforms. Drawing tools are minimal, indicator options are limited, and the charts do not support advanced workflows. Yahoo Finance is best for casual investors and traders who need quick lookups and basic technical analysis, not for serious chart-based trading strategies.
Pros
Completely free with real-time quotes
No account required for basic use
Financial news and earnings calendars
Portfolio tracking
Research reports on Plus tier
Massive coverage across global markets
Cons
Very basic charting capabilities
Minimal drawing tools
~20 indicators (fewer than StockCharts)
No AI features
No custom scripting or screener depth
Heavy advertising on free tier
Best for: Casual investors who want free stock quotes, news, and basic charting without paying for a dedicated charting platform.
10. Webull — Best Mobile Charting
WebullFree
Webull offers commission-free stock and options trading with a polished interface and the best mobile charting experience among free platforms. For StockCharts users who want to check charts on their phone — something StockCharts handles poorly — Webull provides a clean, responsive mobile app with real-time data, about 20 technical indicators, and basic drawing tools.
The desktop and web platforms are also well-designed, with a modern dark-mode interface that feels current. You get real-time market data, extended hours trading, fractional shares, and a community features section. The charting is adequate for basic technical analysis, though it lacks the depth that serious chartists need.
Where Webull falls short for StockCharts refugees is in analytical depth. The indicator library is limited to around 20 studies, there are no predefined scans comparable to StockCharts, no AI features, no advanced screener, and no backtesting capabilities. Webull is a solid trading app with basic charting, not a full replacement for StockCharts' analytical toolkit — but it is completely free and works beautifully on mobile.
Pros
Completely free with real-time data
Best-in-class mobile charting experience
Commission-free stock and options trading
Clean, modern interface
Extended hours trading
Fractional shares
Cons
Limited indicator library (~20 indicators)
No AI features or advanced analysis
No backtesting
No custom scripting
Limited drawing tools
No predefined scans like StockCharts
Best for: Traders who want a free, modern mobile-first platform with basic charting and commission-free trading execution.
What StockCharts Gets Wrong in 2026
StockCharts built its reputation on accessible technical analysis. Predefined scans, clean chart galleries, Point & Figure charts, and educational content made it a starting point for many traders. But the platform has failed to evolve with the market. Here are the core problems:
Pricing that does not match value: At $24.95 to $39.95 per month, StockCharts charges premium prices for basic charting. Platforms like ChartingLens offer more features on their free tiers than StockCharts provides on its paid plans. You are paying for a brand name, not for cutting-edge technology.
No AI features at any price: In 2026, AI-powered analysis is table stakes for serious charting platforms. StockCharts has no AI buy/sell signals, no AI assistant, no automated pattern recognition, and no AI-powered backtesting. Every analysis requires manual effort.
Outdated interface: While ACP improved things, StockCharts still feels like a platform designed for a previous era. The chart interactivity, drawing tools, and overall user experience lag behind what modern platforms deliver.
No real-time data on free tier: In a market where real-time data is expected, StockCharts gates real-time quotes behind its paid plans. ChartingLens, TradingView, Barchart, Webull, and Yahoo Finance all offer real-time data for free.
Limited screener compared to alternatives: StockCharts predefined scans were innovative when they launched, but they are now outclassed by the screening capabilities of Finviz, TC2000, and ChartingLens — all of which offer more powerful, customizable screening on their free tiers.
For traders who have been loyal StockCharts subscribers for years, the gap between what you are paying and what you could get elsewhere has never been wider. The 2026 charting landscape has moved forward. StockCharts has not.
How to Choose the Right StockCharts Alternative
The right alternative depends on what you used StockCharts for most. Here is a quick decision framework:
If you want the most features for the least cost: ChartingLens. Its free tier offers more than StockCharts' paid plans, and Premium at $14.99/mo is less than half what StockCharts charges for Basic.
If you need community and custom scripting: TradingView. Its Pine Script ecosystem and social features are unmatched.
If you relied on StockCharts for screening: Finviz for visual heat maps and snapshots, or TC2000 for condition-based custom scans.
If you want automated technical analysis: TrendSpider for auto trendlines and multi-timeframe overlays, or ChartingLens for AI-powered pattern recognition and signals.
If you want free professional-grade charting: Thinkorswim with a Schwab account gives you 300+ indicators and thinkScript at no cost.
If you need Point & Figure charts: TradingView or Barchart both offer P&F alongside modern interactive charting.
If you do fundamental research: Koyfin for Bloomberg-style dashboards with deep financial data.
If you want AI-powered analysis: ChartingLens is the clear leader with AI signals, an AI assistant, auto pattern recognition, and plain-English backtesting.
Frequently Asked Questions
ChartingLens is the best free StockCharts alternative in 2026. It offers 40+ technical indicators on its free tier with no per-chart limits, AI buy/sell signals for 2,000+ stocks, an AI trading assistant, auto chart pattern recognition, insider trading data, hedge fund holdings, a plain-English strategy backtester, and bar replay with paper trading. No download required — it runs entirely in your browser with no ads on any tier.
StockCharts costs $24.95 to $39.95 per month for its Basic and Extra plans, which primarily deliver static-style charting with predefined scans. In 2026, platforms like ChartingLens offer AI buy/sell signals, an AI trading assistant, auto chart pattern recognition, insider data, hedge fund holdings, and bar replay — all for free or $14.99/mo. For most traders, StockCharts no longer offers enough value relative to its price.
StockCharts Advanced Charting Platform (ACP) was an upgrade over the classic Java-based charts, but it still lacks AI features, real-time interactivity on the free tier, and modern drawing tools. ChartingLens offers a fully interactive, web-based charting experience with AI-powered analysis including buy/sell signals, auto pattern recognition, and Volume Profile (VRVP) at $14.99/mo. TradingView also provides a more modern and interactive charting experience than ACP.
Yes. ChartingLens offers a stock screener with CL Score ranking on its free tier that covers similar ground to StockCharts predefined scans — but adds AI buy/sell signals that scan 2,000+ stocks daily. Finviz also offers free screening with heat maps. Both platforms provide more actionable screening than StockCharts' predefined scan lists without requiring a paid subscription.
Point & Figure (P&F) charts are a StockCharts specialty. TradingView and Barchart both offer P&F chart types if you rely on them. However, many traders who used P&F charts for identifying support/resistance and trend reversals find that modern AI-powered tools deliver the same insights more efficiently. ChartingLens auto-detects chart patterns and draws AI support/resistance levels, effectively replacing the manual analysis that P&F charts require.
StockCharts is known for its market breadth indicators like the Advance-Decline Line, Bullish Percent Index, and sector rotation tools. Barchart offers similar breadth data across multiple asset classes. Koyfin provides macro and market-level dashboards. For AI-enhanced market analysis that goes beyond raw breadth data, ChartingLens scans 2,000+ stocks daily with buy/sell signals and provides a CL Score ranking that captures market-wide momentum and sentiment.
ChartingLens is the cheapest platform with comprehensive AI features. Its free tier includes AI buy/sell signals and an AI trading assistant. Premium at $14.99/mo adds Volume Profile (VRVP), unlimited backtesting, and expanded AI analysis. StockCharts has no AI features at any price point. By comparison, TrendSpider starts at $22/month for automated analysis, and TradingView has no built-in AI features at any price.
Conclusion: The Best StockCharts Alternative Depends on Your Workflow
StockCharts served a generation of technical analysts well, but the platform has not kept pace with the rapid evolution of charting technology. In 2026, you can get more features, better interactivity, and AI-powered analysis at a lower price — or for free — from multiple alternatives.
For most traders looking for the most complete alternative, ChartingLens offers the broadest feature set at the lowest cost. Its AI capabilities alone — buy/sell signals, an AI assistant, pattern recognition, plain-English backtesting, and custom AI indicators — represent features that StockCharts simply does not have at any price. Add Volume Profile, insider data, hedge fund holdings, and a stock screener, and you have a platform that does not just replace StockCharts — it leapfrogs it entirely.
If you need specific features like Pine Script (TradingView), visual heat maps (Finviz), condition-based scanning (TC2000), or free professional-grade desktop charting (thinkorswim), the alternatives above cover every use case. The best way to decide is to try the platforms that match your needs. If you want to start with the one that gives you the most out of the box, ChartingLens is a clear first stop.
Get AI signals, strategy backtesting, insider data, hedge fund holdings, Volume Profile, and real-time charts. No download required. No credit card needed.