If you have been trading for more than a year, you already know the difference between a platform that helps you trade and a platform that gets in your way. You know how it feels when you are stacking RSI, MACD, and a volume profile on a 15-minute chart and your software starts lagging. You know the frustration of hitting an indicator limit when you are mid-analysis. You know what it costs — not in subscription fees, but in missed setups — when your platform does not surface the data you need fast enough.
This is not an article about the best trading platform for beginners. There is no section explaining what a candlestick is. No glossary of basic terms. If you are looking for your first charting tool, this page is not for you. This is for traders who already have a workflow, already pay for tools, and want to know if there is something better.
You have probably tried TradingView. Maybe you are paying $29.95 a month for Plus and wondering why you still cannot get native AI analysis. Maybe you have used Thinkorswim and gotten tired of the sluggish desktop app. Maybe you came from MetaTrader and outgrew its dated interface. Maybe you have bounced between three different platforms trying to get pattern recognition, insider data, and clean charts in one place. If that sounds familiar, our TradingView alternatives guide digs into the specific tradeoffs. This guide cuts through the noise and ranks the five best trading platforms for serious traders in 2026 based on what actually matters: speed, indicator depth, AI-driven analysis, pattern recognition, institutional-grade data, and value for money.
Every platform on this list was evaluated from the perspective of an experienced trader running real strategies with real money. No affiliate rankings. No padding the list with tools that belong in a different category. Five platforms, ranked, with a direct comparison table so you can make a decision and get back to trading.
What Separates a Serious Trading Platform from a Beginner Toy
Before ranking platforms, it is worth defining what "serious" actually means in this context. If your trading software checks all of the boxes below, you are working with a professional-grade tool. If it misses two or more, you are fighting the tool instead of the market.
A 3-indicator cap is a beginner restriction. Serious setups require RSI, MACD, moving averages, volume analysis, Bollinger Bands, and often custom combinations stacked on the same chart. If your platform limits this, it limits your edge.
Delayed data is useless for active trading. If you are watching a breakout and your chart is 15 minutes behind, you are not trading — you are guessing. Real-time feeds for stocks and crypto are non-negotiable.
In 2026, AI is not optional for traders who want an edge. AI processes thousands of data points simultaneously — price action, volume divergences, indicator confluences, pattern formations — and flags setups faster than any human screen.
Head and shoulders. Double tops. Ascending wedges. Bull flags. If you are still drawing every pattern by hand, you are spending time on work your platform should be doing for you. Automated pattern detection is a multiplier for experienced traders.
Insider trading filings. Hedge Fund Holdings changes. Fund holdings. This is the data that separates retail traders who guess from retail traders who see what smart money is actually doing. If your platform does not surface this, you are flying blind on half the picture.
Ads, social feeds, gamification badges, and tutorial popups have no place on a professional trading screen. You need charts that load fast, tools that respond instantly, and an interface designed for analysis — not engagement metrics.
Most beginner-focused platforms fail on at least three of these criteria. They cap indicators to push you into paid tiers. They show delayed data on free plans. They prioritize community features over analytical depth. They have never heard of insider tracking or AI signals. And their interfaces are cluttered with elements designed to keep casual users scrolling rather than help active traders analyze.
The platforms ranked below pass this filter. They differ in how many boxes they check and at what price, which is exactly what the ranking reflects.
The 5 Best Platforms for Serious Traders in 2026
1. ChartingLens — The Edge You Actually Pay For
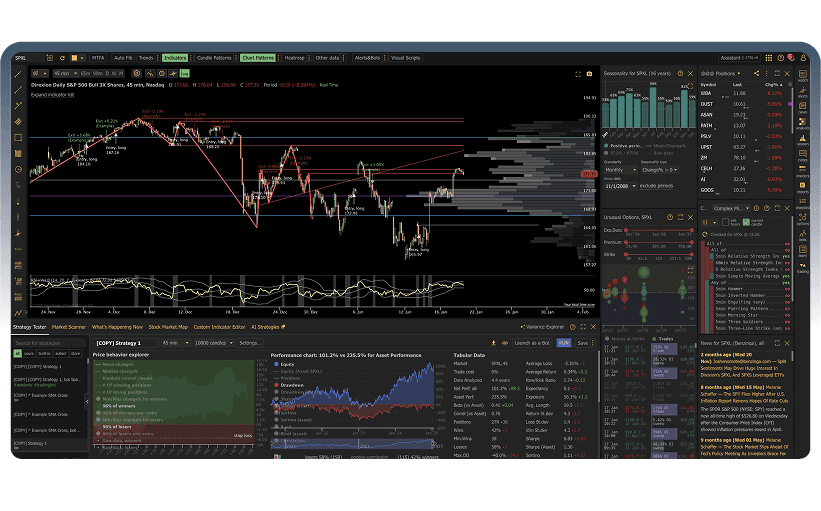
ChartingLens takes the top spot because it is the only platform in 2026 that combines every feature a serious trader needs — AI signals, unlimited indicators, automatic pattern recognition, insider data, and hedge fund holdings — under a single roof at a price point that makes every other option look bloated.
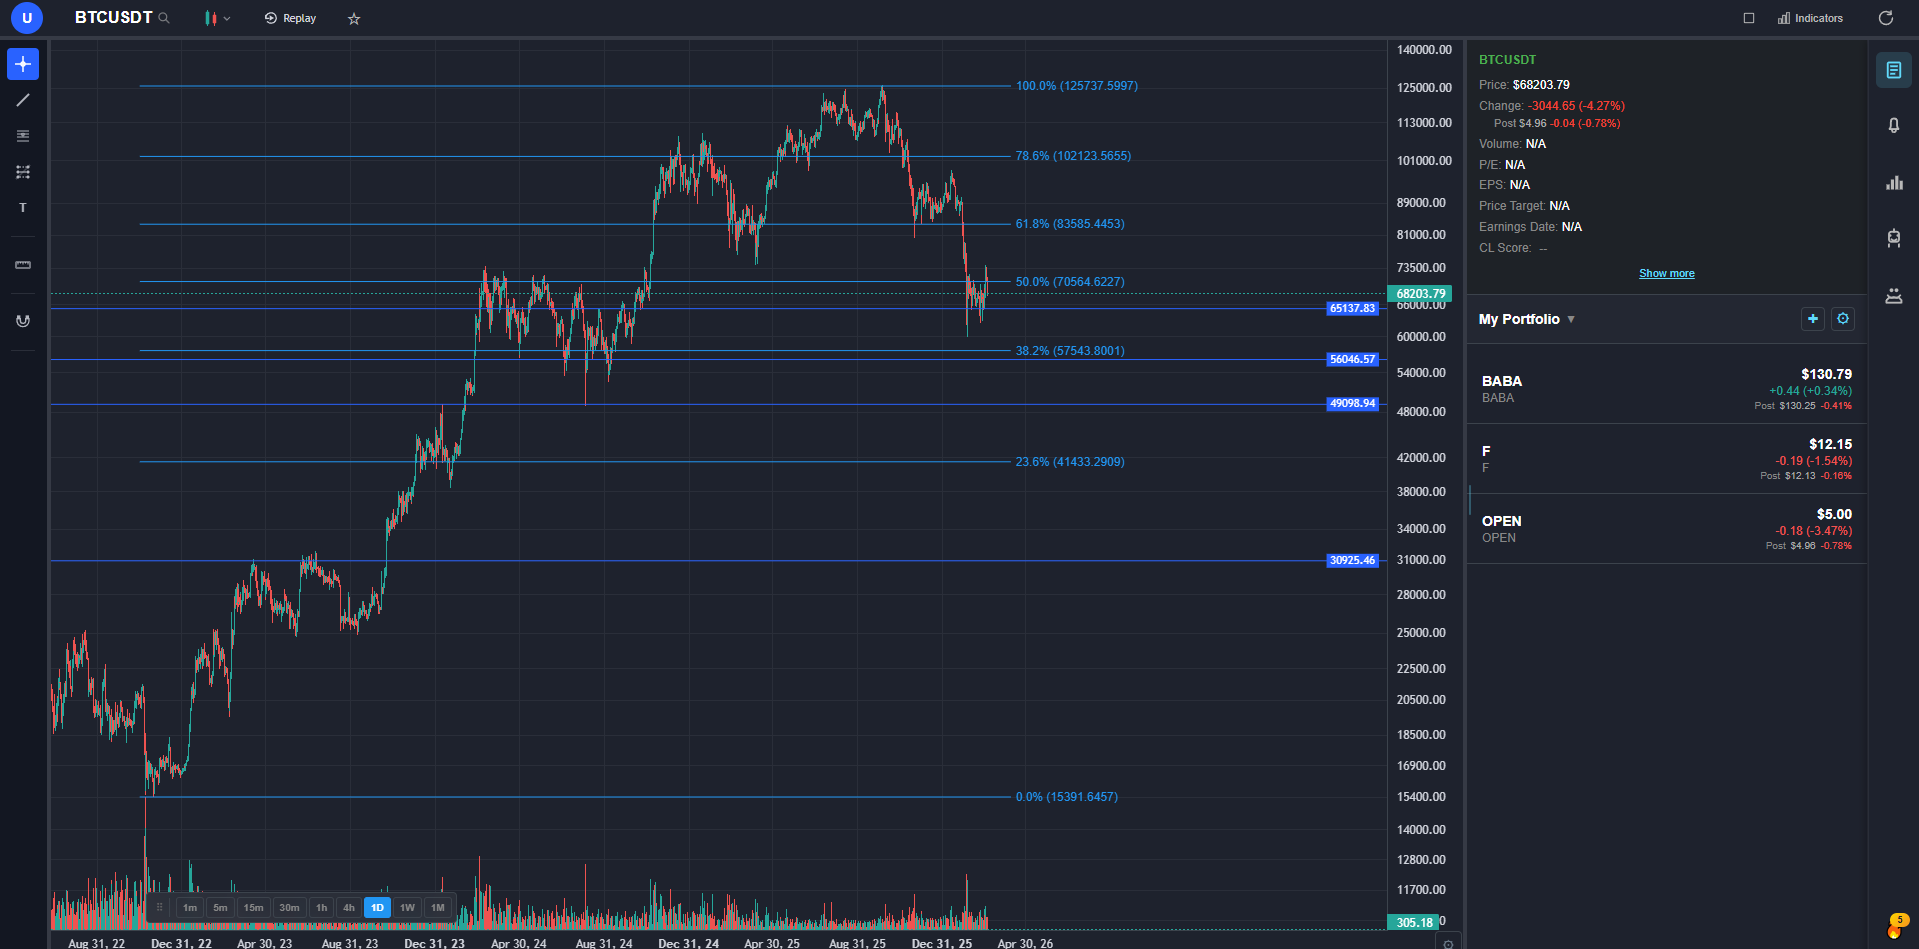
Start with what matters most: the charting engine. Real-time data for stocks and crypto. Unlimited technical indicators per chart with no cap on stacking. Every standard indicator you use daily — RSI, MACD, EMA, SMA, Bollinger Bands, VWAP, volume profile, Stochastic, ATR, and more — is available and responsive. There are no artificial restrictions that force you into a higher tier just to run a standard swing trading setup. The charts load fast, the interface is clean, and there is zero advertising on any tier.
ChartingLens also includes Volume Candles — a professional chart type where each candlestick's width scales with its trading volume, giving you an instant visual read on where institutional activity is concentrated. TradingView locks this behind their $67.95/month Premium tier. ChartingLens includes it at $14.99/mo.
Where ChartingLens separates from the pack is its AI layer. The platform generates AI-powered buy and sell signals by scanning over 2,000 stocks for high-probability setups using machine learning models trained on price action, volume, indicator confluences, and historical patterns. These are not simple moving average crossover alerts. The AI evaluates multi-factor confluence — the kind of analysis that would take you hours of manual screening — and surfaces actionable signals that you can filter by strategy type, timeframe, and risk tolerance.
The automatic chart pattern recognition identifies head-and-shoulders, double tops and bottoms, ascending and descending wedges, triangles, bull and bear flags, cup-and-handle formations, and other classical patterns in real time. You do not need to eyeball every chart and hope you spot the formation before it completes. The system does the pattern scanning across your watchlist while you focus on confirming and executing.
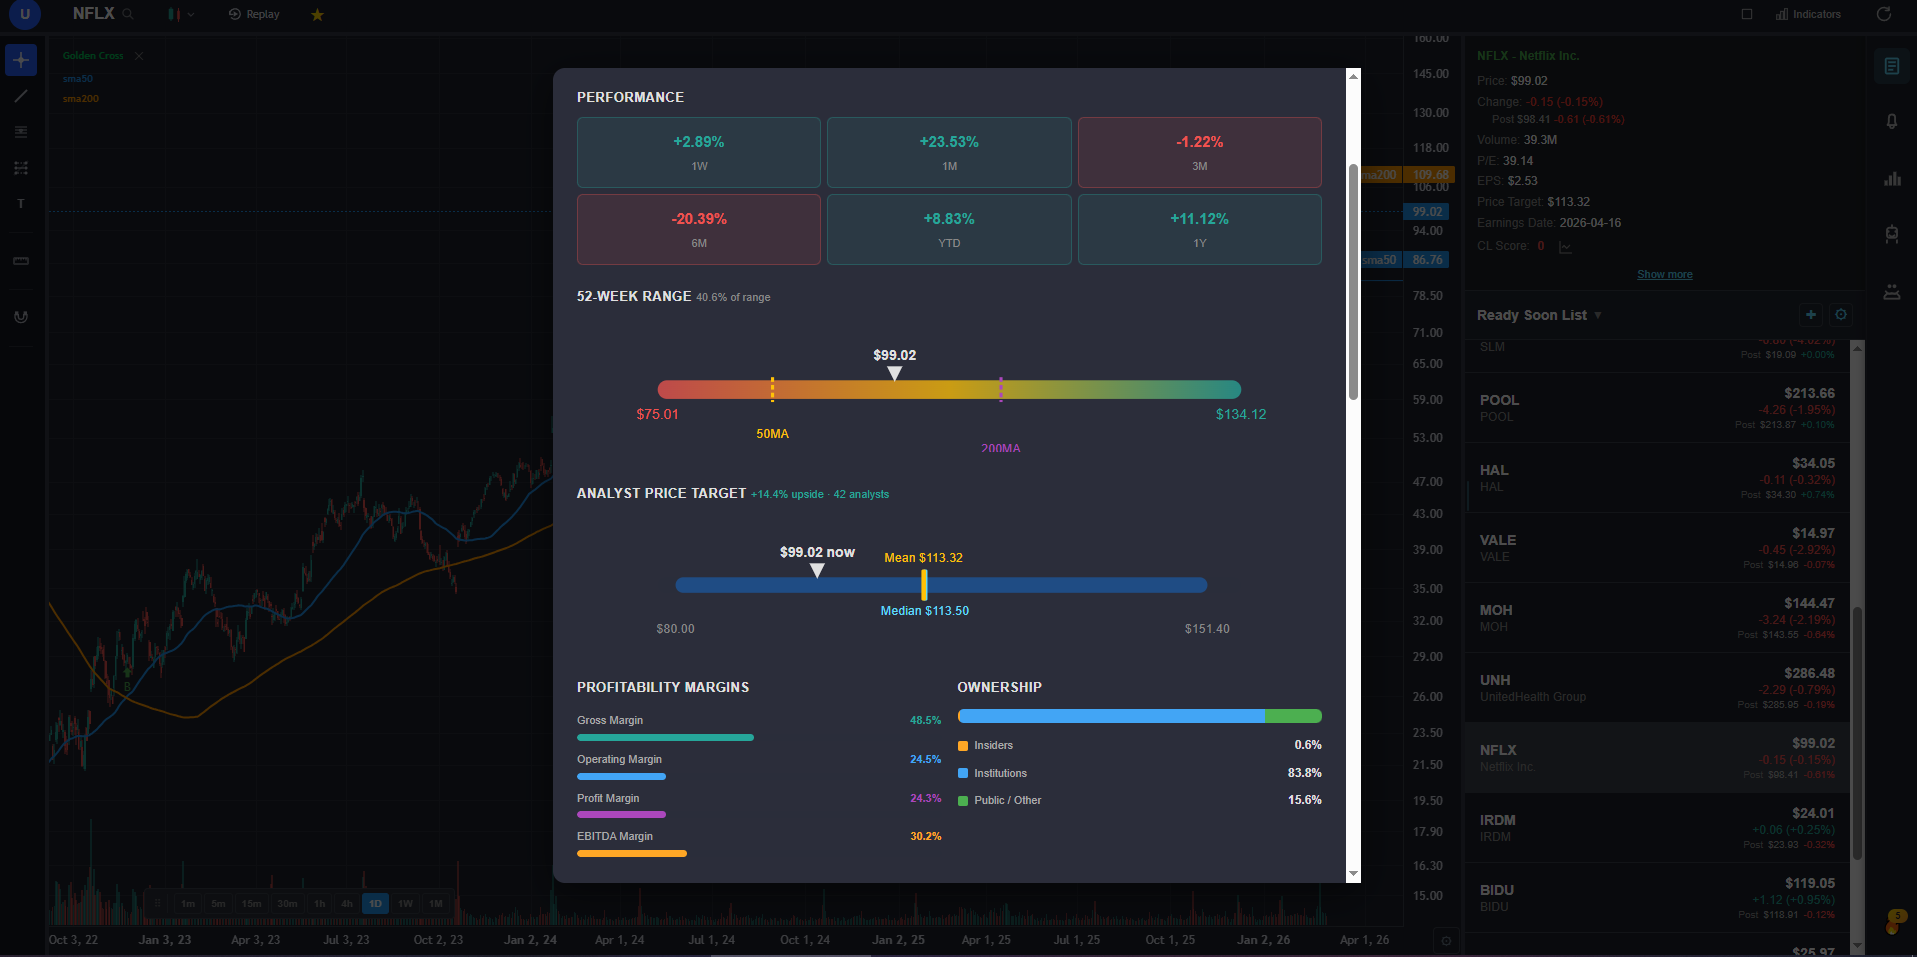
Then there is the data layer that most platforms simply do not offer. ChartingLens integrates real-time insider trading data — SEC Form 4 filings showing what corporate executives and board members are buying and selling — directly into the charting interface. It also features hedge fund holdings that lets you follow the portfolio moves of legendary investors like Warren Buffett, Michael Burry, and other institutional heavyweights through 13F filings. This is institutional-grade intelligence that used to require a Bloomberg Terminal or expensive data subscriptions. Here it is included on the free tier.
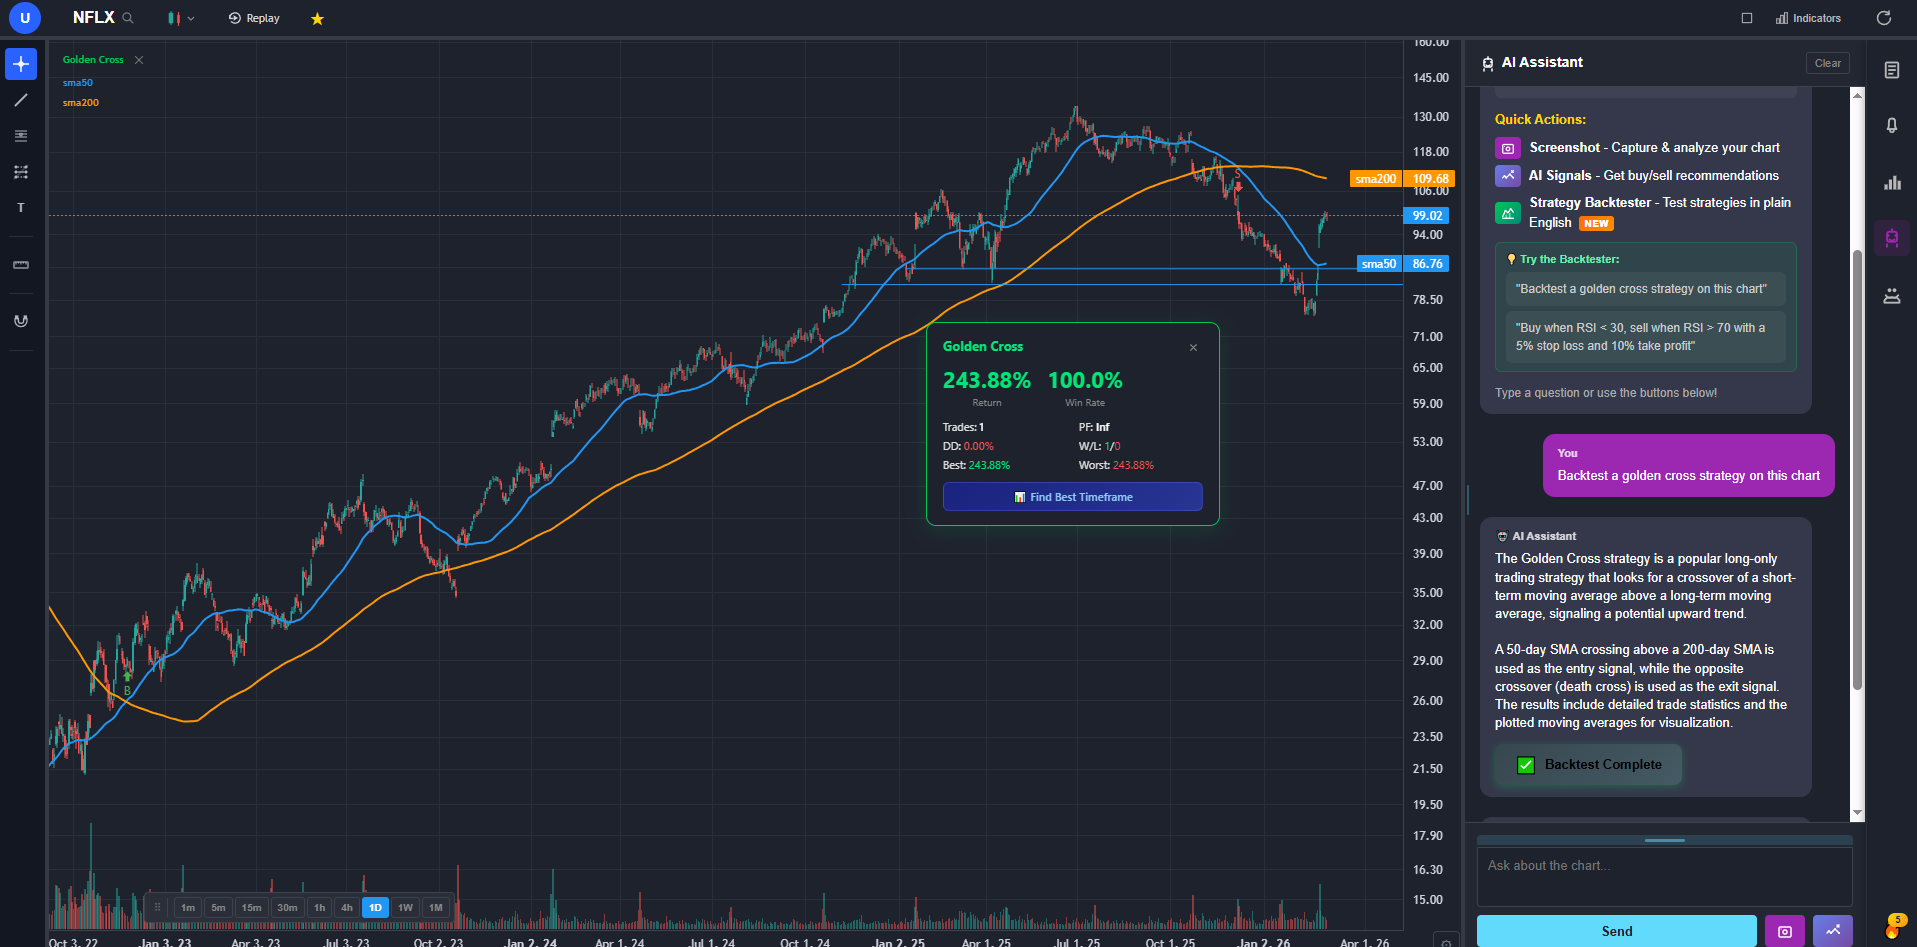
The AI trading assistant is the other standout. Ask it about any stock, any pattern, any setup, and get analysis grounded in the current chart data. It is not a generic chatbot reciting textbook definitions. It reads the chart, evaluates the indicators, and gives you context-specific analysis. Think of it as a second set of eyes that never gets tired and never lets emotion color the read.
ChartingLens also includes a strategy backtester that lets you describe trading strategies in plain English and test them against historical data. Free users get two built-in strategies (Golden Cross and RSI Mean Reversion) with AI-powered timeframe optimization that automatically finds the best-performing timeframe. Premium users can create unlimited custom strategies — any entry/exit logic you can describe, the AI turns it into executable code and runs a full backtest with Sharpe ratio, drawdown analysis, and trade-by-trade breakdowns.
The free tier includes all of this — unlimited indicators, AI signals, pattern recognition, insider data, hedge fund holdings, built-in backtesting, and the AI assistant. The premium plan at $14.99 per month unlocks unlimited custom backtesting, extended historical data, deeper AI analysis, and priority access to new features. At that price, ChartingLens premium costs less than a single month of TradingView Plus, and it delivers capabilities that TradingView does not offer at any tier.
Strengths
- Unlimited indicators per chart, no cap on any tier
- AI buy/sell signals scanning 2,000+ stocks
- Automatic chart pattern recognition (real-time)
- Insider trading data and hedge fund holdings
- AI trading assistant with chart-aware analysis
- Strategy backtesting with AI timeframe optimization
- Volume Candles at $14.99/mo (TradingView charges $67.95/mo)
- Real-time data for stocks and crypto
- No ads, no clutter, no social feed noise
- Premium at $14.99/mo — cheapest pro-grade platform
Limitations
- Newer platform — smaller community than TradingView
- No Pine Script equivalent for custom scripting (yet)
- No integrated brokerage or order execution
2. Thinkorswim (Schwab) — The Powerhouse That Needs a Manual
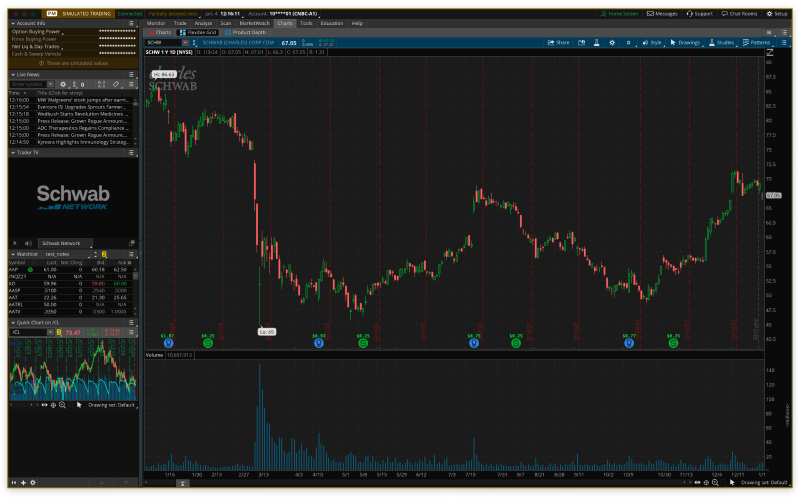
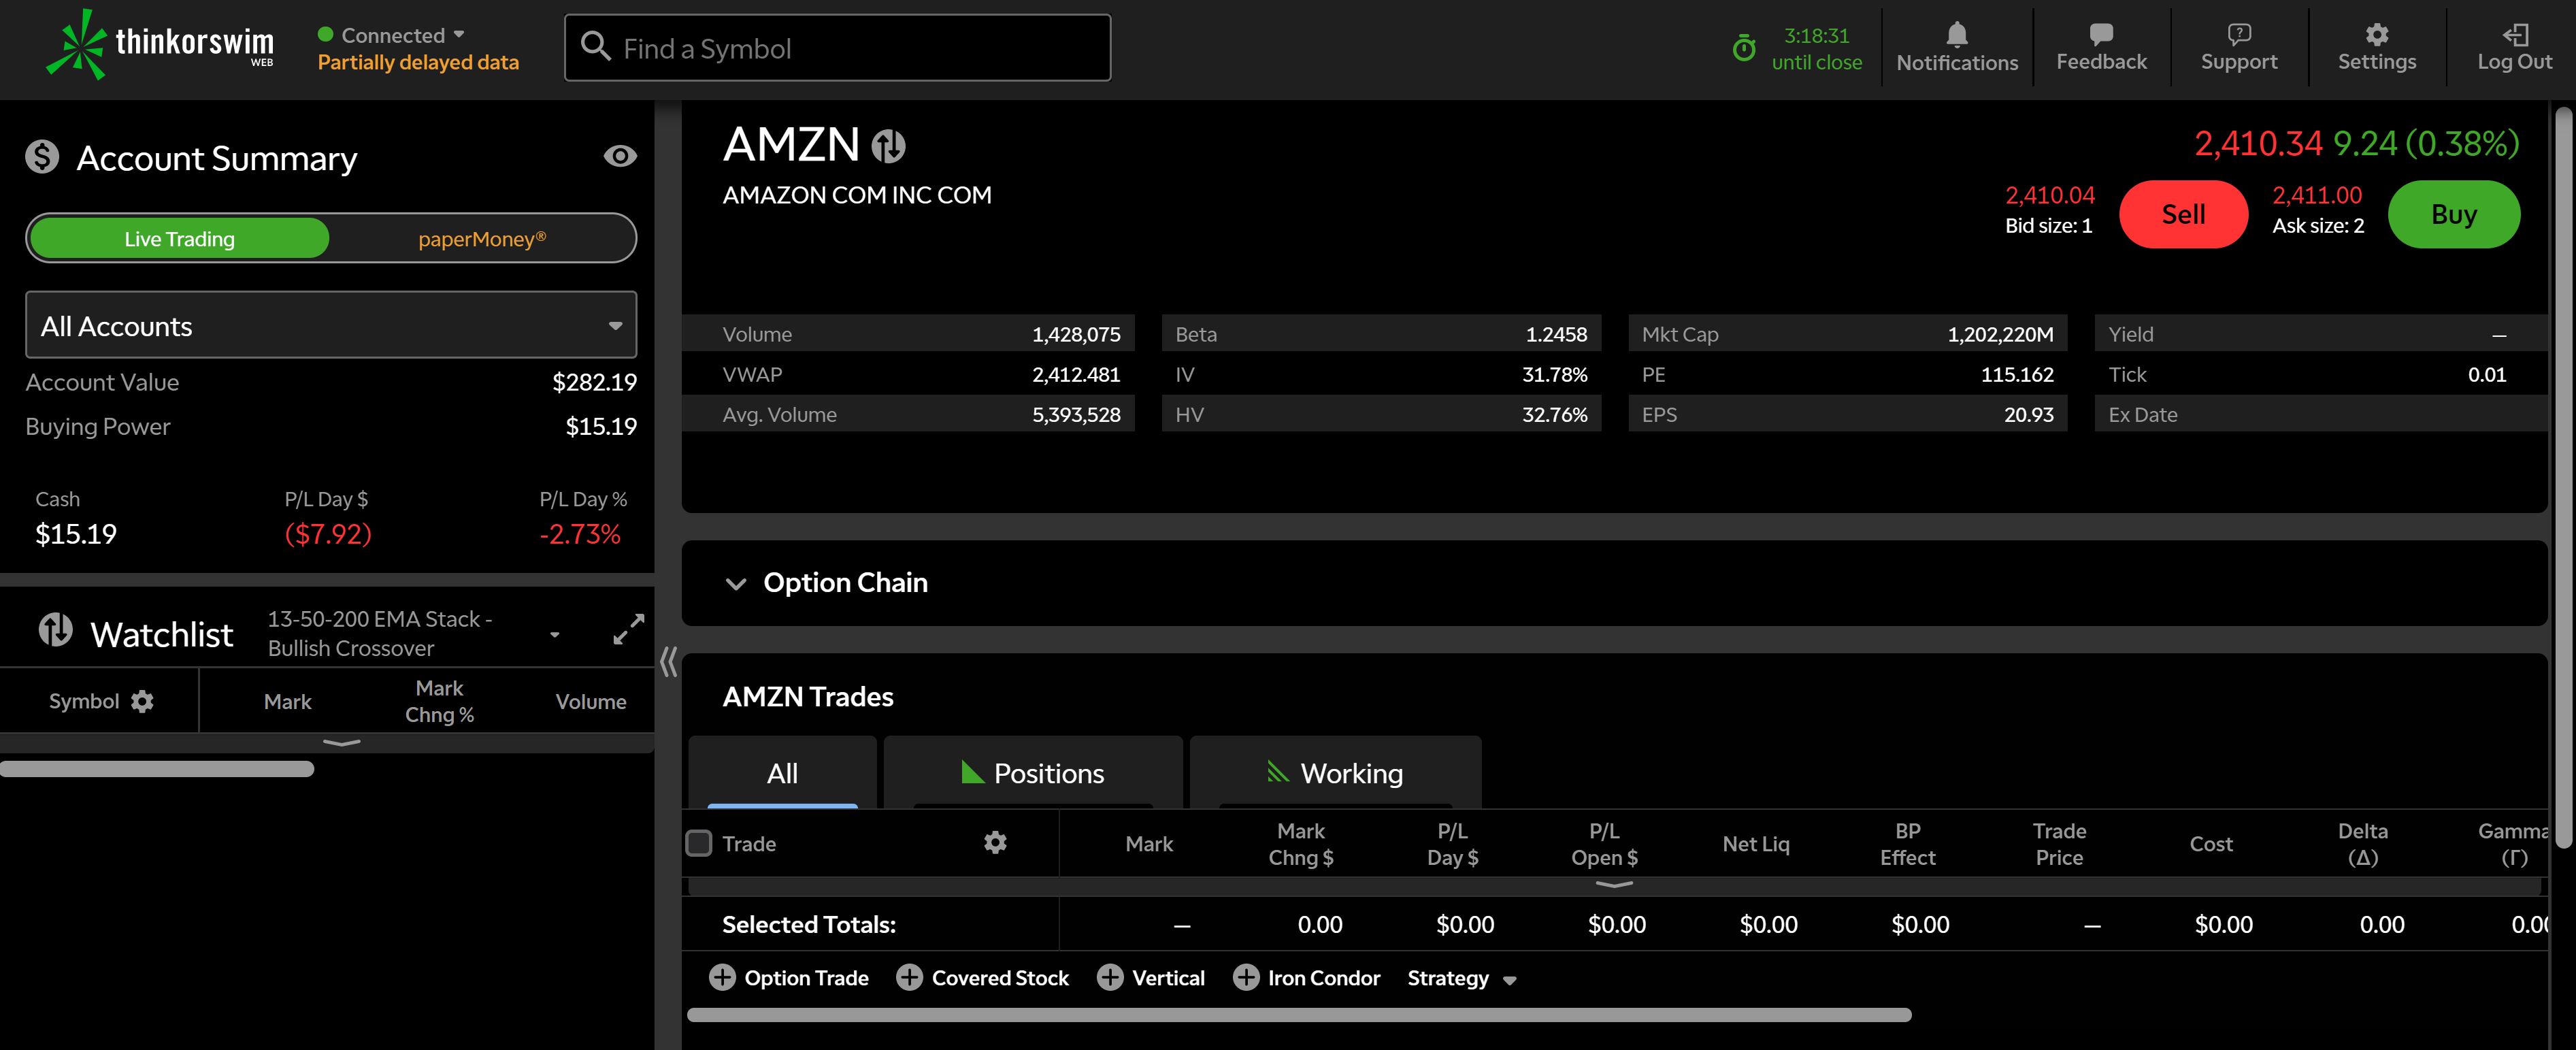
Thinkorswim is the platform that serious traders have used for years when they needed raw analytical horsepower and did not mind a steep learning curve. Now operated under Charles Schwab after the TD Ameritrade acquisition, it remains one of the most feature-dense charting applications available to retail traders — and it is technically free, as long as you open a Schwab brokerage account.
The indicator library is massive: over 400 technical studies. If you need an obscure oscillator or a niche volatility metric, Thinkorswim probably has it. The thinkScript language lets you build custom indicators and strategies with granular control over entry and exit logic. Options analysis is where Thinkorswim truly has no equal — the options chains, probability analysis, risk profiles, and Greeks visualization are institutional-grade. If you trade complex options spreads, iron condors, or calendar strategies, there is no better free tool.
But the weaknesses are real. The desktop application is heavy, resource-intensive, and can feel sluggish even on modern hardware when running multiple studies across multiple charts. The interface is dense to the point of being overwhelming — most traders spend weeks getting comfortable with the layout. The web version sacrifices too many features to be a viable primary tool. And critically, Thinkorswim has no AI analysis, no automated pattern recognition, no AI assistant, and no insider trading data overlays. You get raw indicators and you do all the interpretation yourself.
For options-heavy traders who live in probability curves and Greeks, Thinkorswim is still the platform to beat. For everyone else, the lack of AI and the interface friction push it behind ChartingLens for daily use. Many serious traders use both: ChartingLens for chart analysis, AI signals, and pattern detection, and Thinkorswim for options execution.
Strengths
- 400+ technical indicators and studies
- Best-in-class options analysis and Greeks
- thinkScript for custom indicator development
- Paper trading with live data
- No subscription fee (free with account)
Limitations
- Requires Schwab brokerage account
- Steep learning curve, dense interface
- Desktop app is heavy and can lag
- No AI signals, no pattern recognition, no insider data
- Web version lacks key desktop features
3. TrendSpider — Automation at a Premium Price
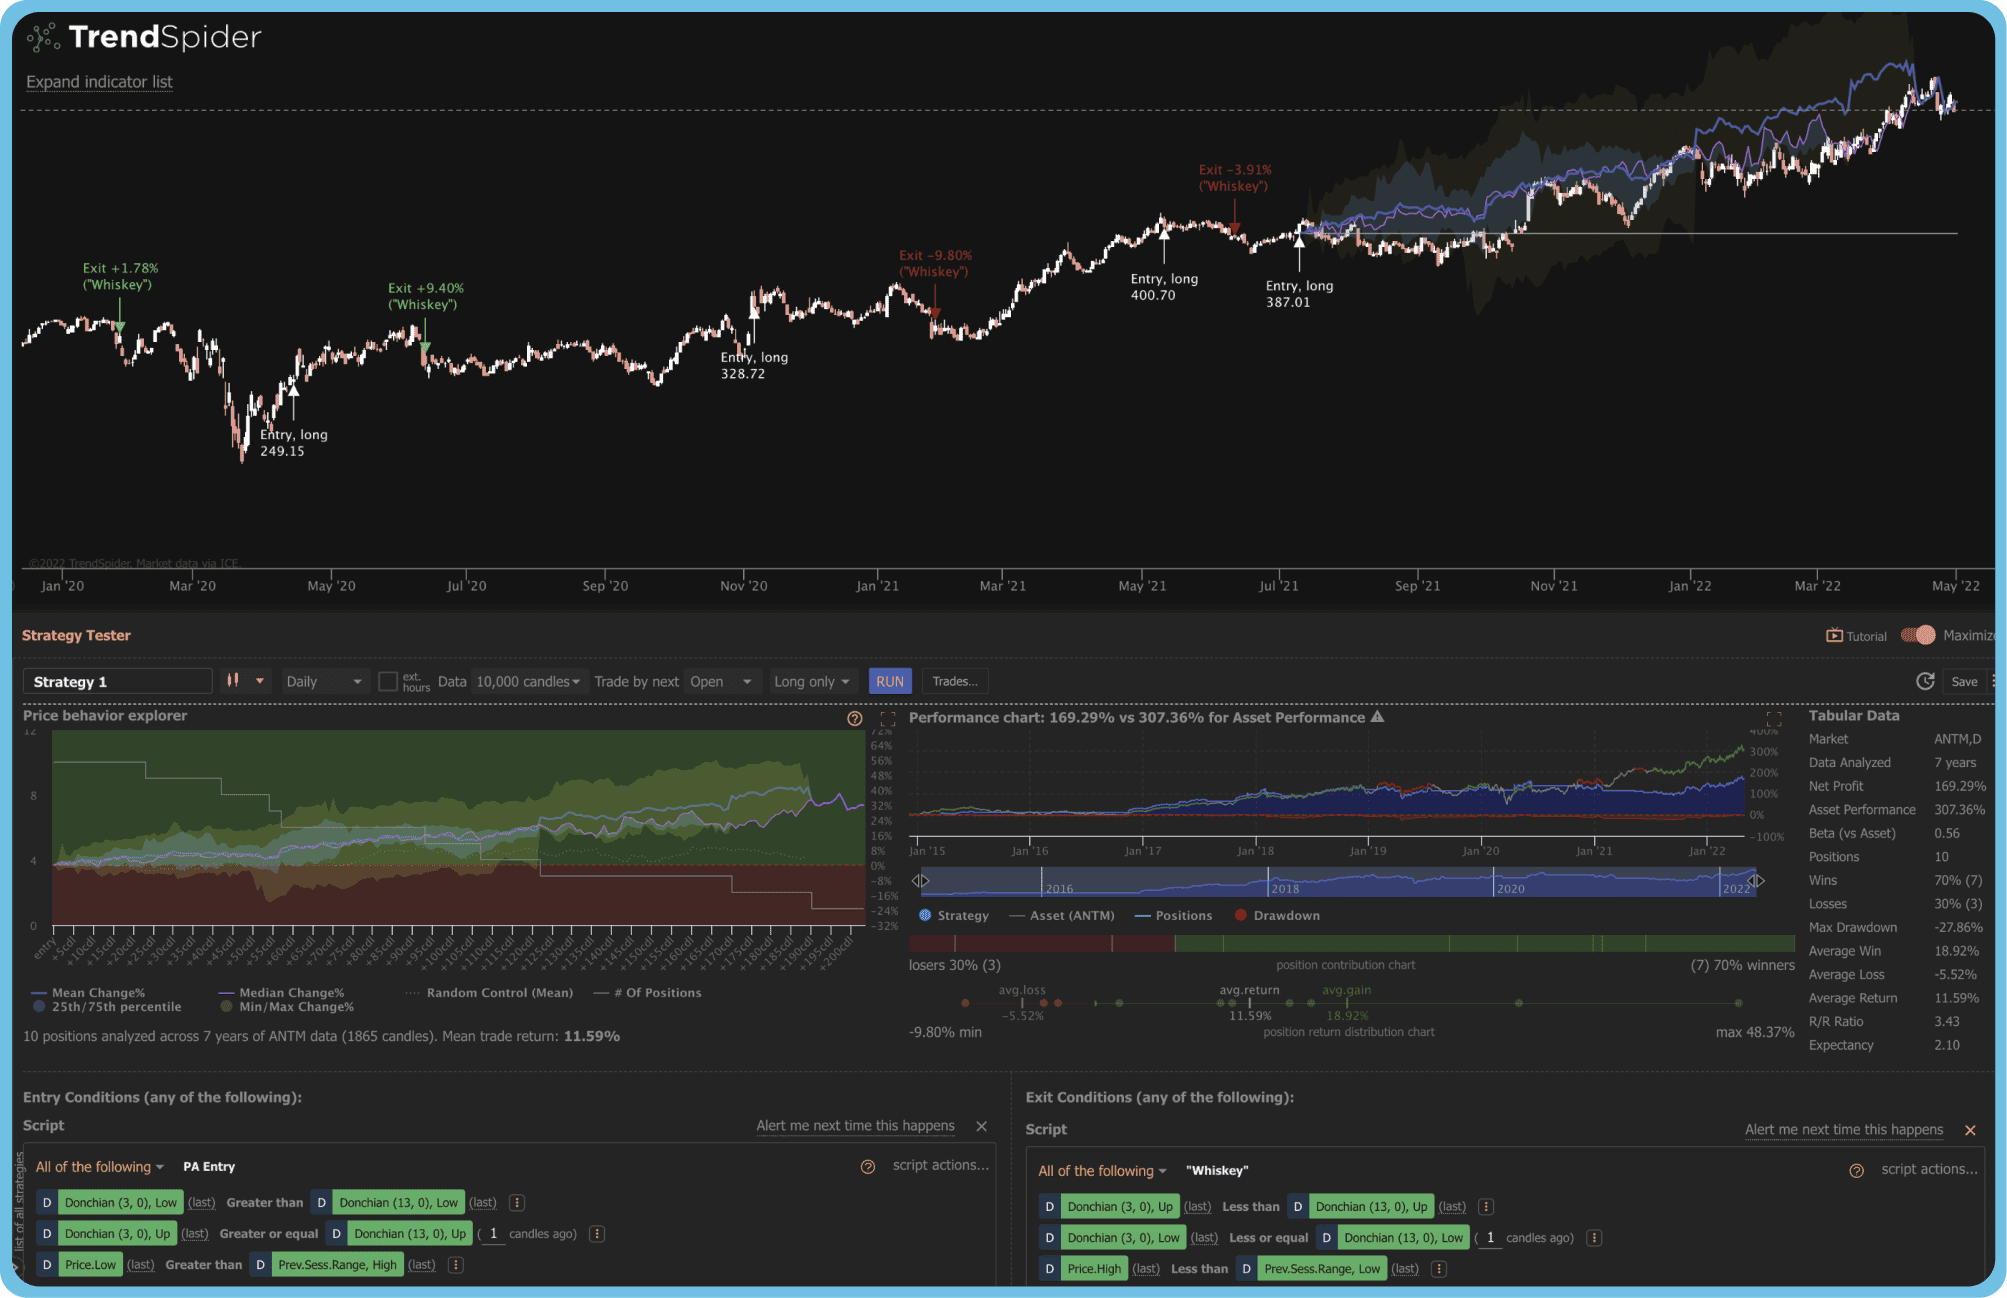
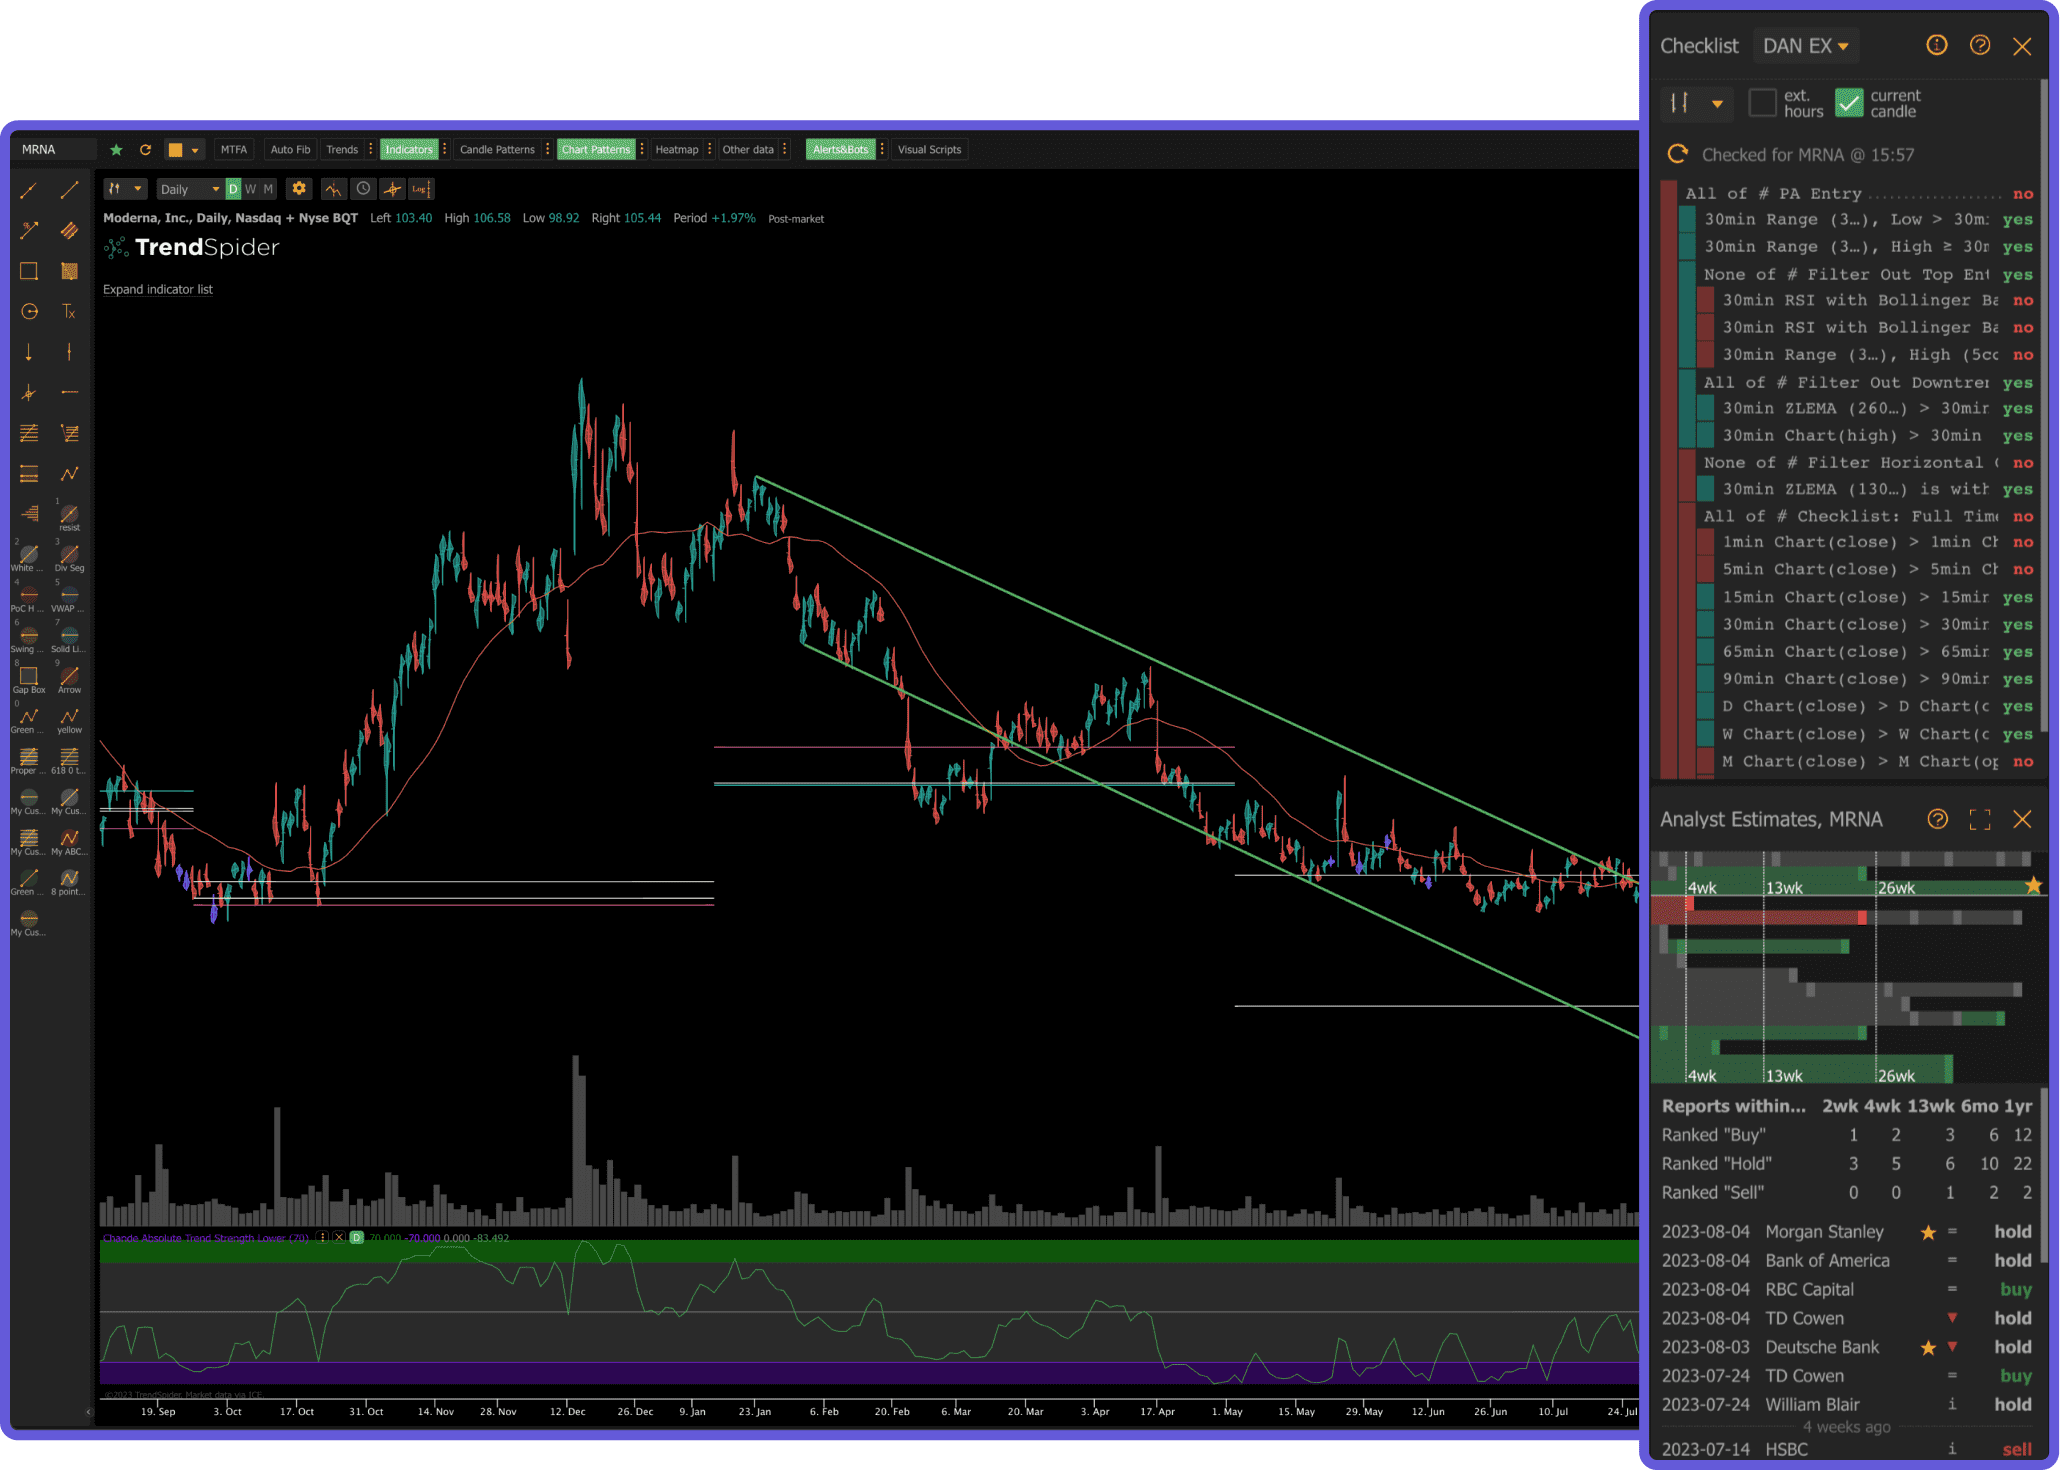
TrendSpider built its reputation on one promise: automate the tedious parts of technical analysis. The platform automatically draws trendlines, identifies support and resistance levels, plots Fibonacci retracements, and detects candlestick patterns without you lifting a finger. It also offers multi-timeframe analysis on a single chart, which is genuinely useful for traders who confirm setups across daily, 4-hour, and 1-hour charts simultaneously.
The backtesting engine is visual and strategy-oriented. You can build entry and exit rules, test them against historical data, and optimize parameters — all without writing code. The automated alerts trigger based on pattern completions, indicator crossovers, and trendline breaks. For traders who spend hours manually drawing lines and scanning for patterns, TrendSpider can compress that workflow significantly.
The catch is the price and the lack of a free tier. TrendSpider starts at $22 per month for the Essential plan, which is already more than ChartingLens Premium. The Elite plan runs $47 per month and the Advanced plan costs even more. There is no way to evaluate the platform without paying. And while the automation features are solid, TrendSpider does not offer free AI buy/sell signals, an AI trading assistant, insider trading data, or hedge fund holdings. You are paying a premium for automated chart drawing and backtesting, but missing the broader intelligence layer that platforms like ChartingLens include.
TrendSpider earns its spot at number three because the automation is genuinely useful and well-executed. But the value proposition weakens when you compare what $22 per month buys here versus what $14.99 (or free) buys on ChartingLens. If automated trendlines and visual backtesting are critical to your workflow, TrendSpider delivers. If you want the broadest feature set for the money, it falls short.
Strengths
- Automated trendline and support/resistance detection
- Multi-timeframe analysis on one chart
- Visual strategy backtesting (no code required)
- Automated candlestick pattern recognition
- Smart alerts based on pattern completions
Limitations
- No free tier — starts at $22/mo
- No AI buy/sell signals or AI assistant
- No insider trading data or hedge fund holdings
- Interface can feel cluttered with many automations active
- Higher tiers get expensive fast ($47+/mo)
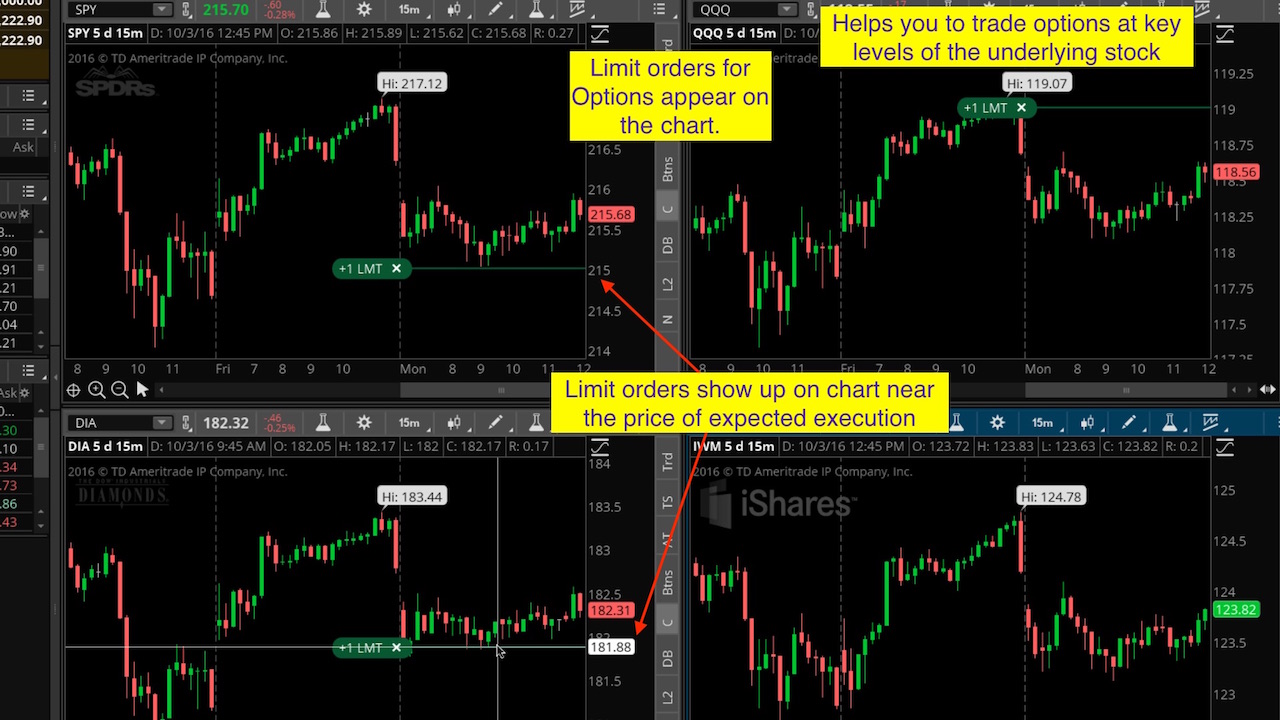
4. TradingView Plus — Good Charts, Overpriced for What You Get


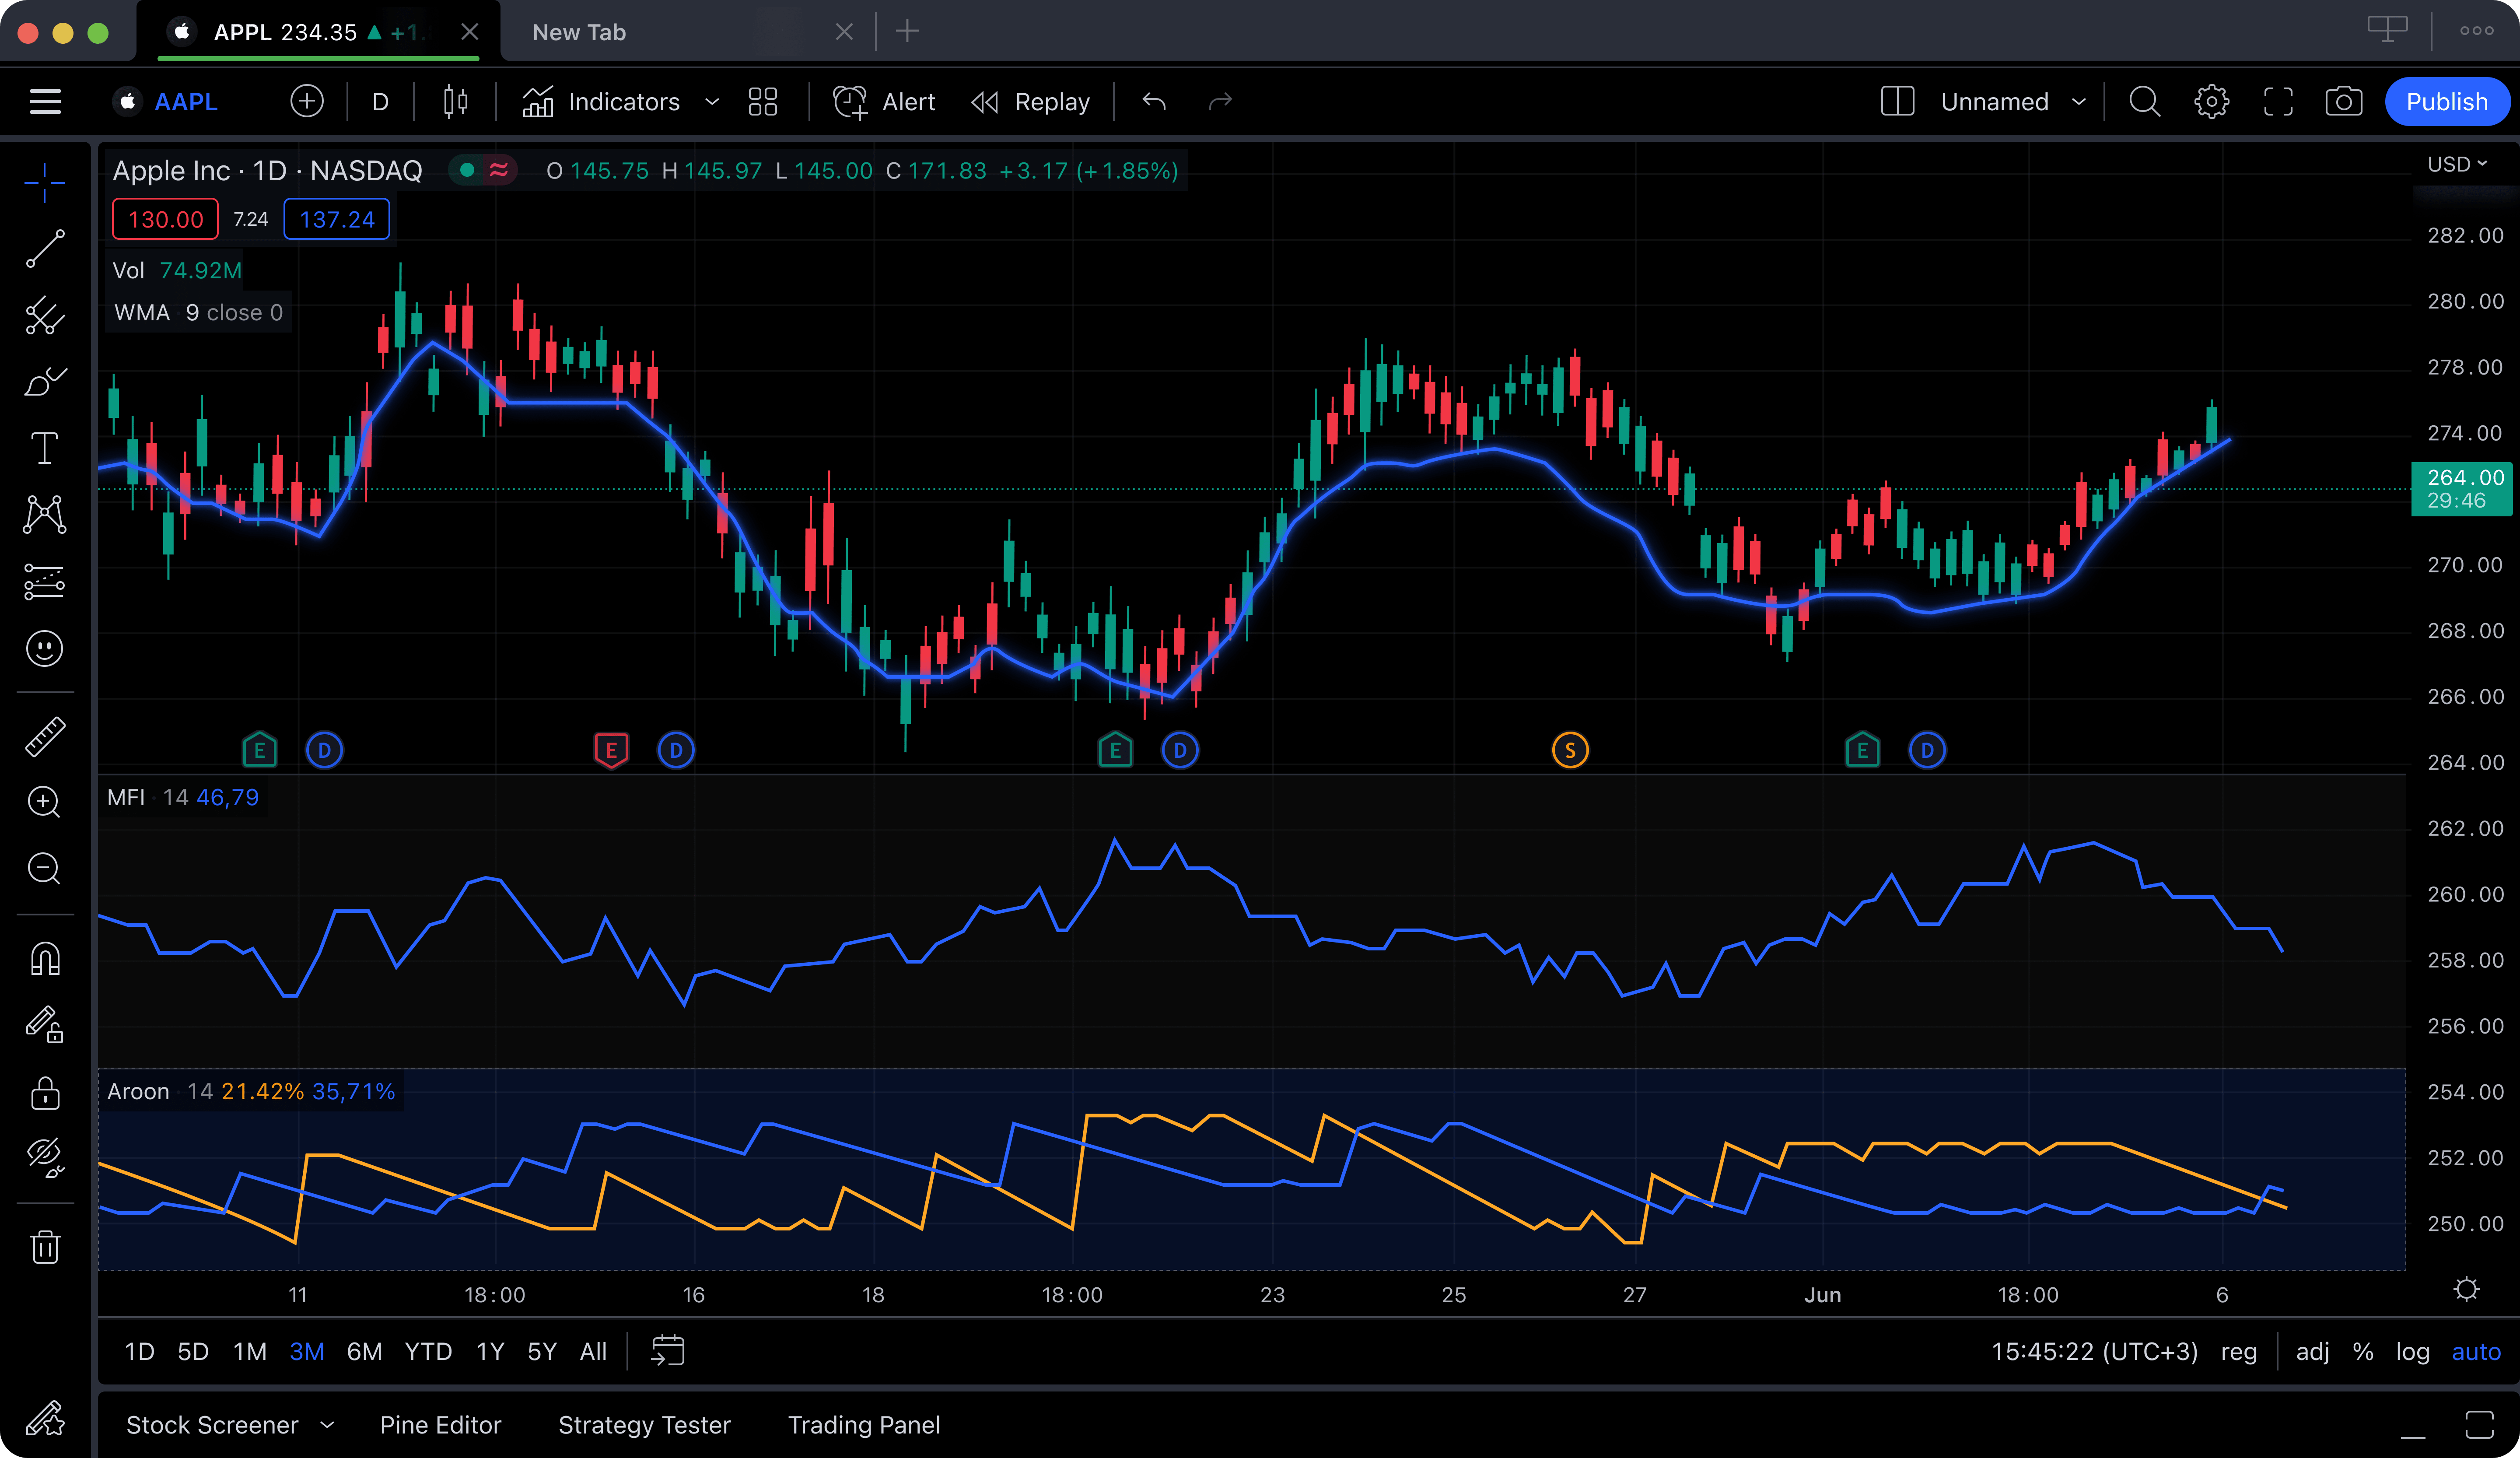
TradingView does not need an introduction. You have used it. You probably have an opinion about it. The charting engine is smooth, Pine Script gives you a powerful custom indicator language, and the community is massive with thousands of published scripts and ideas. For pure charting — drawing trendlines, annotating charts, running standard indicators — TradingView's interface is arguably the cleanest in the industry.
The problem for serious traders is the value equation. TradingView's free tier limits you to a single indicator per chart, one alert, and one layout while displaying ads. That is not a charting platform; it is a demo. To get to a usable level, you need at least the Plus plan at $29.95 per month, which gives you 5 indicators per chart and 100 alerts. If you want 25 indicators per chart and 400 alerts, that is the Premium plan at $59.95 per month. Over a year, you are paying $360 to $720 for a charting tool that still does not include AI analysis, automated pattern recognition, insider data, or hedge fund holdings.
Pine Script is a legitimate advantage. If you build custom strategies, backtest entry and exit logic, or have a library of proprietary indicators coded in Pine, that ecosystem is hard to leave. The social community also has value — crowdsourced ideas, published analyses, and shared scripts can surface setups you would not find alone. But these are ecosystem benefits, not charting benefits. The core charting functionality at $29.95 per month delivers less analytical depth than what ChartingLens provides at $14.99.
TradingView lands at number four because the platform itself is well-built, but the price-to-feature ratio does not hold up in 2026. When platforms offer AI signals, pattern recognition, and institutional data at a third of the cost, paying $30+ per month for charts and a social feed is a harder sell than it used to be. If you are locked into Pine Script, TradingView still makes sense. If you are evaluating fresh, there are better options for the money.
Strengths
- Smooth, polished charting interface
- Pine Script for custom indicators and strategies
- Massive community with published scripts
- Broad asset coverage (stocks, crypto, forex, futures)
- Broker integrations for direct execution
Limitations
- $29.95/mo just to get 5 indicators per chart
- No native AI signals, AI assistant, or pattern recognition
- No insider trading data or hedge fund holdings
- Free tier is essentially unusable for serious analysis
- Premium ($59.95/mo) for full indicator depth
5. TC2000 — Fast Scanning, Dated Everything Else
TC2000 has been a day trader staple for over two decades, and its core strength has not changed: real-time stock scanning. The EasyScan feature lets you build condition-based scans using price, volume, and indicator criteria and run them against the entire market in real time. When a stock breaks above its 20 EMA on 3x average volume while RSI crosses above 50, TC2000 will find it before most other platforms. For traders whose strategy starts with "scan, spot, execute," that speed matters.
The charting tools are solid but not exceptional. Standard technical indicators are available, charts are responsive, and the drawing tools cover the basics. TC2000 also offers a built-in brokerage with paper trading, which eliminates the need to switch between analysis and execution. The condition-based alert system is flexible and can notify you across multiple criteria simultaneously.
Where TC2000 falls behind is everything that has changed in trading technology since its core was built. The interface feels dated compared to modern browser-based platforms. The design language is functional but not visually refined. There is no meaningful AI integration — no AI signals, no AI assistant, no automated pattern recognition beyond what the scanner rules can approximate. There is no insider trading data overlay, no hedge fund holdings, and the community and social features are minimal.
At $14.99 per month for the Silver plan, TC2000 is priced competitively. But that $14.99 buys you scanning and charting with a dated interface. The same $14.99 on ChartingLens Premium buys you scanning, charting, AI signals, pattern recognition, insider data, hedge fund holdings, and an AI assistant. The value gap is significant. TC2000 earns its spot on this list for scan speed, but the overall package has not kept pace with what 2026 demands from professional trading tools.
Strengths
- Fast real-time stock scanning (EasyScan)
- Condition-based alerts across multiple criteria
- Built-in brokerage with paper trading
- Responsive charts with standard indicators
- Competitive pricing at $14.99/mo
Limitations
- Dated interface that has not aged well
- No AI signals, AI assistant, or pattern recognition
- No insider trading data or hedge fund holdings
- Limited community and social features
- Desktop-first design, browser experience is weaker