Why Learning to Read Charts Matters
Every price movement in the stock market tells a story. Behind every green candle is a wave of buyers who believed the price would keep rising. Behind every sharp sell-off is a shift in sentiment that caught traders off guard. Learning how to read stock charts for beginners is about developing the ability to see these stories unfold in real time, and to use that understanding to make smarter trading and investing decisions.
Stock charts are not just lines on a screen. They are a visual record of the battle between supply and demand, compressed into a format that lets you spot patterns, identify trends, and anticipate what might happen next. Professional traders, hedge fund managers, and institutional investors all rely on chart analysis as a core part of their decision-making process. And the good news is that you do not need years of experience or an expensive Bloomberg terminal to start reading charts effectively. The fundamentals are straightforward, and today's free charting tools put professional-grade charts in everyone's hands.
This guide walks you through everything you need to know, from the most basic chart types to advanced patterns and indicators. By the end, you will understand how to look at any stock or crypto chart and extract meaningful information from it. Whether you are interested in day trading, swing trading, or simply timing your long-term investments better, these skills form the foundation of technical analysis.
What Is a Stock Chart?
A stock chart is a graphical representation of a security's price over time. The horizontal axis represents time, and the vertical axis represents price. At its simplest, a chart answers the question: "Where has the price been, and where might it be headed?"
There are three main types of stock charts, and each displays price data in a different way.
Line Charts
A line chart is the simplest form of stock chart. It draws a single continuous line connecting the closing price of each time period. If you are looking at a daily line chart, each point on the line represents the closing price for that day. Line charts are clean and easy to read, which makes them a good starting point for absolute beginners. However, they hide a lot of information. You cannot see the high, low, or opening price for each period, and you miss the intraday volatility that occurred between opens and closes.
Bar Charts (OHLC)
Bar charts, also called OHLC charts (Open, High, Low, Close), show four data points for each time period. Each bar is a vertical line where the top represents the highest price reached during the period and the bottom represents the lowest. A small horizontal tick on the left side marks the opening price, and a tick on the right side marks the closing price. Bar charts give you a much fuller picture of price action than line charts, but they can be visually dense and harder to read at a glance.
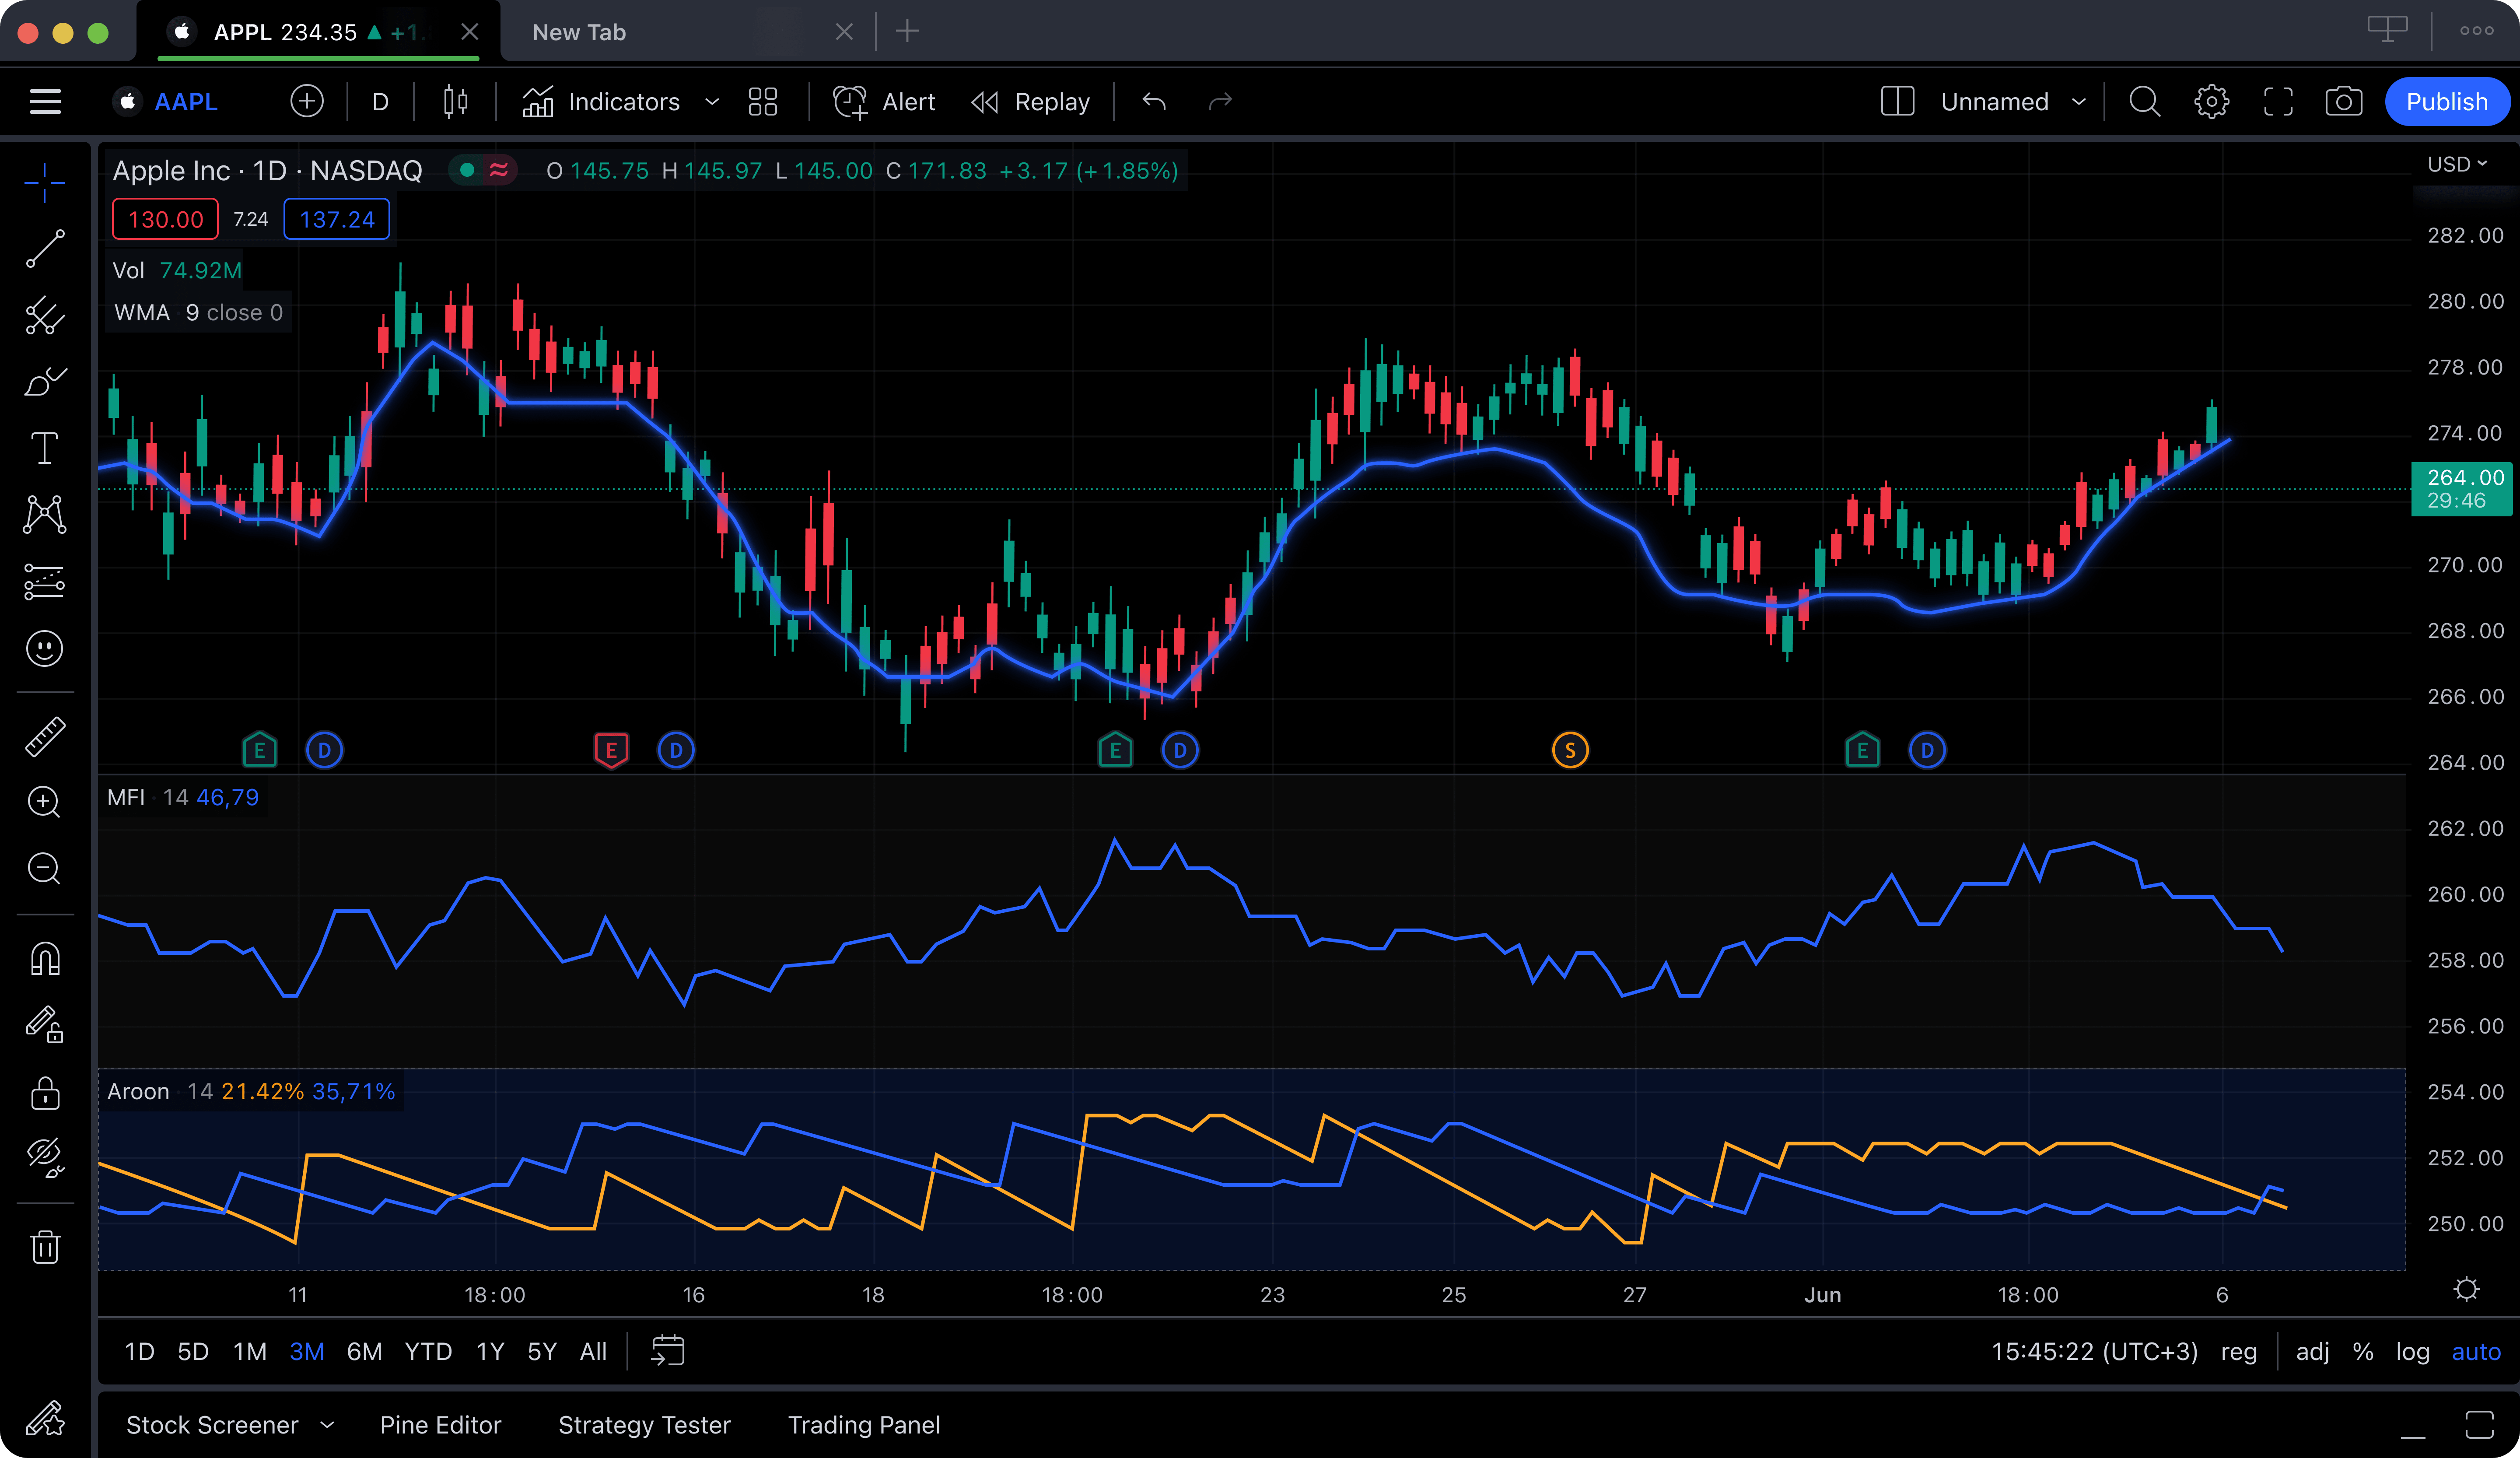
Candlestick Charts
Candlestick charts convey the same OHLC data as bar charts but in a more visually intuitive format. For a deep dive into individual candle formations, see our candlestick patterns guide. Each period is represented by a "candle" with a rectangular body and thin lines (called wicks or shadows) extending above and below. The body shows the range between the open and close. If the close is higher than the open, the candle is typically colored green (bullish). If the close is lower than the open, the candle is red (bearish). The wicks show how far the price moved above and below the body during that period.
Candlestick charts are by far the most popular chart type among active traders. They make it immediately obvious whether buyers or sellers were in control during each period, and the shapes of individual candles and groups of candles form recognizable patterns that have predictive value. The rest of this guide focuses primarily on candlestick charts because they are what you will encounter on virtually every modern stock chart analysis tool.
Understanding Timeframes
Every chart operates on a specific timeframe that determines what each candle (or bar, or point) represents. Common timeframes include:
- 1-minute and 5-minute charts: Used by day traders to track rapid intraday moves. Each candle represents one or five minutes of trading.
- 15-minute and 1-hour charts: Popular for intraday and short-term swing trading. They smooth out noise while still capturing meaningful intraday trends.
- Daily charts: The default timeframe for most swing traders and investors. Each candle represents one full trading day.
- Weekly and monthly charts: Used for identifying long-term trends and major support/resistance levels. Each candle represents a week or month of trading.
The timeframe you choose should match your trading style. Day traders live on 1-minute to 15-minute charts. Swing traders typically analyze daily and 4-hour charts. Long-term investors focus on weekly and monthly charts. There is no single "correct" timeframe; the best approach is to use multiple timeframes together, starting with a higher timeframe to understand the big picture and then drilling down to a lower timeframe for precision entries.
How to Read Candlestick Charts
Candlestick charts were developed by Japanese rice traders in the 18th century, and they remain the gold standard for chart analysis today. To read them effectively, you need to understand two things: the anatomy of a single candle, and the patterns formed by groups of candles.
Anatomy of a Candle
Every candlestick has up to four components:
- The body: The thick rectangular section that shows the range between the opening and closing price. A long body means there was a large difference between the open and close, indicating strong buying or selling pressure.
- The upper wick (shadow): The thin line extending above the body, showing the highest price reached during the period. A long upper wick suggests that buyers pushed the price up but sellers drove it back down before the close.
- The lower wick (shadow): The thin line extending below the body, showing the lowest price reached. A long lower wick means sellers pushed the price down but buyers stepped in to drive it back up.
- The color: Green (or white) means the close was higher than the open, which is bullish. Red (or black) means the close was lower than the open, which is bearish.
The relative size and proportion of these components tells you a lot about market sentiment during that period. A candle with a large green body and short wicks shows strong, decisive buying. A candle with a small body and long wicks shows indecision, where neither buyers nor sellers could maintain control.
Common Candlestick Patterns
Certain candlestick formations appear repeatedly across all markets and timeframes. Here are the patterns that every beginner should learn first.
Doji: A doji forms when the opening and closing prices are virtually identical, creating a candle with an extremely small body (or no body at all) and wicks on both sides. It signals indecision in the market. When a doji appears after a strong trend, it often signals that the trend may be losing momentum. The key is context: a doji after a long uptrend is more significant than a doji during sideways consolidation.
Hammer: A hammer has a small body at the top of the candle and a long lower wick (at least twice the length of the body), with little or no upper wick. It typically appears at the bottom of a downtrend and signals potential reversal. The long lower wick shows that sellers pushed the price down aggressively, but buyers stepped in and pushed it back up near the open. The bullish version is called a hammer; the bearish equivalent at the top of an uptrend (small body at the bottom, long upper wick) is called a shooting star.
Engulfing patterns: A bullish engulfing pattern occurs when a small red candle is followed by a larger green candle whose body completely "engulfs" the previous candle's body. It signals a shift from selling pressure to buying pressure and is considered a strong reversal signal, especially when it appears at a support level. The bearish engulfing is the mirror image: a small green candle followed by a larger red candle that engulfs it, signaling a shift to selling pressure at a resistance level.
Morning star and evening star: These are three-candle reversal patterns. A morning star consists of a large red candle, then a small-bodied candle (the "star") that gaps down, then a large green candle that closes well into the first candle's body. It signals a bottom reversal. The evening star is the bearish inverse: a large green candle, a small-bodied star that gaps up, and a large red candle. Both are powerful reversal signals when they appear at key price levels.
Beginner Tip
You do not need to memorize dozens of candlestick patterns to start reading charts effectively. Focus on these four first: doji, hammer, engulfing, and morning/evening star. Once you are comfortable recognizing them, you can expand your repertoire. Tools like ChartingLens include automatic pattern recognition that identifies these patterns on your chart, so you can learn by seeing them in real-time market conditions.
Key Technical Indicators Explained
Technical indicators are mathematical calculations applied to price and volume data that help traders identify trends, momentum, volatility, and potential reversals. They appear as overlays on the price chart or in separate panels below it. Here are the six indicators that every beginner should understand.
Simple Moving Average (SMA)
The SMA calculates the average closing price over a specified number of periods. A 50-day SMA, for example, takes the closing price of the last 50 days, adds them together, and divides by 50. The result is a smooth line on the chart that filters out short-term noise and reveals the underlying trend direction. When the price is above the SMA, the trend is generally considered bullish. When the price is below it, the trend is bearish. Traders commonly watch the 20-day, 50-day, and 200-day SMAs. When a shorter SMA crosses above a longer one (like the 50-day crossing above the 200-day), it is called a "golden cross" and is considered a bullish signal. The opposite crossover is called a "death cross."
Exponential Moving Average (EMA)
The EMA works like the SMA but gives more weight to recent prices, making it more responsive to new information. This means the EMA reacts to price changes faster than the SMA, which can be an advantage for short-term traders who need early signals. The trade-off is that the EMA is also more prone to false signals because it whips around more with price volatility. Many traders use both: EMAs for short-term analysis and SMAs for identifying longer-term trends.
Relative Strength Index (RSI)
The RSI is a momentum oscillator that measures the speed and magnitude of recent price changes on a scale from 0 to 100. Readings above 70 suggest the asset is overbought (it has risen too far, too fast, and may be due for a pullback). Readings below 30 suggest it is oversold (it has fallen too far and may be due for a bounce). The RSI is most useful as a warning system: it does not tell you exactly when to buy or sell, but it alerts you when conditions are extreme. Divergence between the RSI and price is especially powerful. If the price is making new highs but the RSI is making lower highs, it suggests the uptrend is weakening.
MACD (Moving Average Convergence Divergence)
The MACD consists of two lines: the MACD line (the difference between the 12-period and 26-period EMAs) and the signal line (a 9-period EMA of the MACD line). A histogram shows the difference between these two lines. When the MACD line crosses above the signal line, it generates a bullish signal. When it crosses below, the signal is bearish. The MACD is effective at identifying changes in momentum and trend direction. It works best in trending markets and can produce false signals during sideways consolidation.
Bollinger Bands
Bollinger Bands consist of three lines: a middle band (typically a 20-period SMA), an upper band (the middle band plus two standard deviations), and a lower band (the middle band minus two standard deviations). The bands expand when volatility increases and contract when volatility decreases. When the price touches or exceeds the upper band, the asset may be overbought. When it touches or drops below the lower band, it may be oversold. A "Bollinger squeeze," where the bands narrow significantly, often precedes a large price move in either direction.
Volume
Volume is the most fundamental indicator and one that many beginners overlook. It measures the total number of shares (or contracts) traded during a given period, typically displayed as bars at the bottom of the chart. Volume confirms the strength of a price move. A breakout above resistance accompanied by high volume is far more significant than the same breakout on low volume. Rising prices on declining volume is a warning sign that the uptrend may be running out of steam. Always check volume alongside price action; it is the difference between a genuine move and a trap.
How Many Indicators Should You Use?
A common beginner mistake is cluttering the chart with too many indicators. Start with two or three that complement each other. For example, a moving average for trend direction, RSI for overbought/oversold conditions, and volume for confirmation. This gives you a well-rounded view without information overload. On ChartingLens, all 40+ indicators are available on the free tier, so you can experiment and find the combination that works best for your strategy.
Support and Resistance: The Foundation of Chart Analysis
If there is one concept in chart reading that matters more than any other, it is support and resistance. These are the price levels where buying or selling pressure has historically been strong enough to halt or reverse a trend. Understanding them transforms the way you look at every chart.
Support is a price level where a stock has repeatedly found buying interest. Think of it as a floor. When the price drops toward a support level, buyers tend to step in because they perceive it as a good value. The more times a price level has held as support, the stronger it becomes. A break below a well-established support level is a significant bearish signal because it means the buyers who were defending that level have been overwhelmed.
Resistance is the opposite: a price level where selling pressure has historically been strong enough to stop the price from rising further. Think of it as a ceiling. When the price approaches resistance, sellers tend to step in because they see it as an attractive exit point or a level where the stock is overvalued. A break above resistance on strong volume is a bullish signal and is called a "breakout."
How to Identify Support and Resistance
Look for price levels where the chart has reversed direction multiple times. The more touches a level has (meaning the more times the price has bounced off it), the stronger it is. Round numbers (like $50, $100, or $200) often act as psychological support or resistance because traders tend to place orders at these levels. Previous highs and lows are natural resistance and support levels. Moving averages (especially the 50-day and 200-day) also function as dynamic support and resistance.
The Flip: When Support Becomes Resistance
One of the most important principles in chart analysis is that once a support level is broken, it often becomes a new resistance level, and vice versa. For example, if a stock has been bouncing off the $50 level for months and then finally breaks below it, the next time the price rallies back up to $50, it will likely encounter selling pressure (resistance) at the very level that used to provide buying support. This "flip" occurs because traders who bought at $50 during the support phase are now underwater and will look to sell at break-even when the price returns to that level.
Mastering support and resistance does not require any indicators at all. It is pure price action analysis. But combining it with indicators like volume (to confirm breakouts) and RSI (to gauge momentum at key levels) makes it significantly more powerful.
Chart Patterns Every Beginner Should Know
Chart patterns are formations created by the price movement over time that have historically preceded specific types of moves. While no pattern guarantees a future outcome, recognizing them gives you a probabilistic edge. Here are the patterns that beginners should focus on first.
Head and Shoulders
The head and shoulders is one of the most reliable reversal patterns. It consists of three peaks: a higher peak (the head) between two lower peaks (the shoulders). The "neckline" is drawn across the low points between the peaks. When the price breaks below the neckline after forming the right shoulder, it signals that the uptrend has ended and a downtrend is beginning. The measured target for the move is typically the distance from the head to the neckline, projected downward from the breakout point. The inverse head and shoulders is the bullish counterpart, appearing at market bottoms.
Triangles
Triangles form when the price action gradually narrows between converging trendlines, compressing into a tighter range before eventually breaking out.
- Ascending triangle: Characterized by a flat resistance line on top and a rising support line on the bottom. The price is making higher lows while bumping against the same resistance level. This is generally a bullish pattern because it shows buyers are becoming increasingly aggressive. A breakout above the flat resistance typically triggers a strong upward move.
- Descending triangle: The mirror image, with a flat support level on the bottom and a declining resistance line on top. The price is making lower highs while holding the same support level. This is generally bearish, with the expected breakdown occurring below the flat support.
- Symmetrical triangle: Both the support and resistance lines converge at an equal angle. This is a neutral pattern that can break in either direction. The breakout direction is the signal, and volume should increase on the breakout for confirmation.
Channels
A channel is formed when the price moves between two parallel trendlines. An ascending channel has both lines sloping upward, with the price bouncing between them. A descending channel slopes downward. Channels help you identify the trend and find entry points: in an ascending channel, buying near the lower trendline and taking profits near the upper trendline is a common strategy. A breakout above the upper trendline of an ascending channel signals acceleration. A breakdown below the lower trendline signals a potential reversal.
Flags and Pennants
Flags and pennants are short-term continuation patterns that appear during strong trends. After a sharp price move (the "flagpole"), the price consolidates briefly in a small rectangular channel (flag) or a small converging triangle (pennant) before continuing in the direction of the original move. These patterns are popular with momentum traders because they offer well-defined entry points with tight stop-loss levels. The measured target is typically the length of the flagpole, projected from the breakout point.
Double Tops and Double Bottoms
A double top forms when the price reaches the same resistance level twice and fails to break through, creating an "M" shape on the chart. It signals that buyers have tried twice to push past a ceiling and failed, suggesting a reversal to the downside. The confirmation comes when the price breaks below the trough between the two peaks. A double bottom is the bullish version: the price hits the same support level twice, forming a "W" shape, and then breaks above the peak between the two lows.
Let AI Find Patterns for You
Scanning for chart patterns across hundreds of stocks is time-consuming, and beginners often second-guess whether what they see is actually a valid pattern. ChartingLens includes automatic pattern recognition powered by AI that identifies these formations on your charts in real time. Instead of spending hours hunting for setups, the patterns come to you. This is especially helpful while you are still learning, because you can compare what the AI detects with your own analysis and learn faster.
Best Charting Apps for Beginners in 2026
Knowing how to read charts is only useful if you have the right tool to read them on. The best charting app for beginners should be easy to navigate, include all the essential indicators, and not bury critical features behind paywalls. Here are the platforms worth considering, ranked by how well they serve someone just starting out.
1. ChartingLens
ChartingLens is the best charting app for beginners in 2026 because it was designed from the start to make chart analysis accessible without sacrificing depth. The free tier includes live stock and crypto charts, over 40 technical indicators (including every indicator covered in this guide: SMA, EMA, RSI, MACD, Bollinger Bands, and more), drawing tools, and cloud-synced chart layouts. There are no ads on any tier, and the interface is clean and intuitive.
What makes ChartingLens uniquely valuable for beginners is its AI trading assistant. Instead of spending hours Googling what a doji means or whether an RSI reading of 75 is significant, you can ask the AI assistant directly while looking at your chart. It explains patterns, interprets indicators, and helps you understand what the chart is telling you in plain language. This turns the platform into both a charting tool and a learning tool simultaneously.
ChartingLens also includes automatic pattern recognition that identifies candlestick patterns and chart formations without any manual work. For a beginner still learning to spot these patterns by eye, having AI confirm or detect what you are seeing accelerates the learning curve dramatically. Add in AI buy signals that scan over 2,000 stocks for high-probability setups, insider trading data, and hedge fund holdings, and you have a stock chart analysis tool that punches well above its free price tag.
Pros
- AI assistant explains charts and patterns as you learn
- Automatic pattern recognition does the work for you
- 40+ indicators included free, no limits per chart
- Clean, beginner-friendly interface with no ads
- Covers both stocks and crypto on the same platform
- Lowest premium price at $14.99/mo if you ever upgrade
Cons
- Newer platform, smaller community than TradingView
- No custom scripting language (yet)
- No built-in brokerage or order execution
2. TradingView


TradingView is the most well-known charting platform in the world, with a massive social community where traders share chart ideas and analysis. Its charting engine is excellent, and the indicator library is enormous. The social aspect can be helpful for beginners who want to see how experienced traders draw their charts and interpret patterns.
The significant drawback for beginners is the free tier restriction. You can only use one indicator per chart on the free plan, which means you cannot overlay a moving average, RSI, and MACD simultaneously, which is exactly what most beginners want to do while learning. You also see ads on the free tier and are limited to a single chart layout. Paid plans start at $14.95 per month, which adds up quickly. There is no AI assistant to explain what you are seeing, and no automatic pattern recognition on any tier.
Pros
- Largest social trading community
- Extensive indicator library on paid tiers
- Pine Script for custom indicators
- Covers stocks, crypto, forex, futures
Cons
- Free tier limited to 1 indicator per chart
- Ads on the free plan
- No AI assistant or automatic pattern recognition
- Paid plans are expensive ($14.95-$59.95/mo)
3. Webull
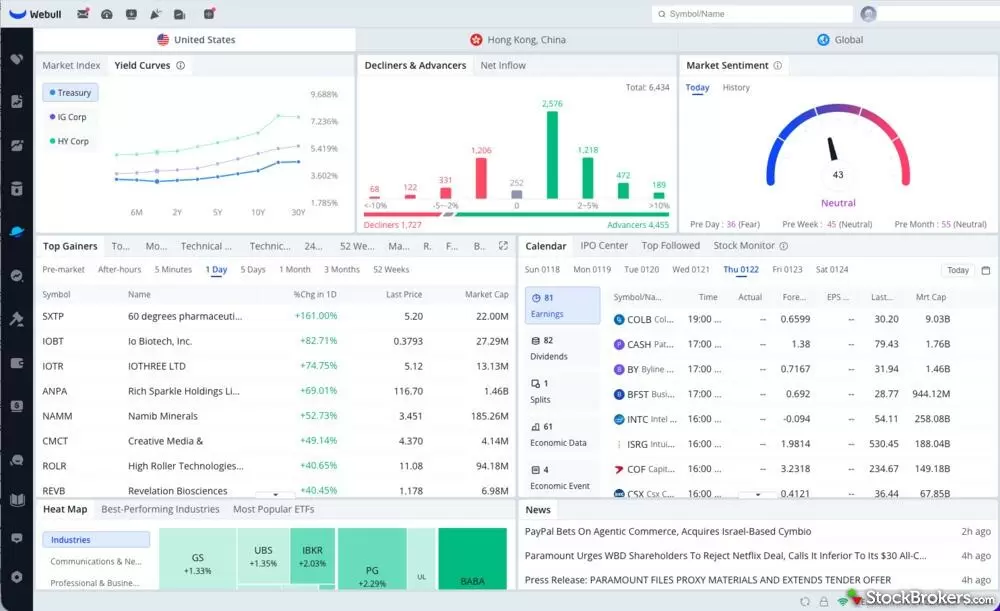
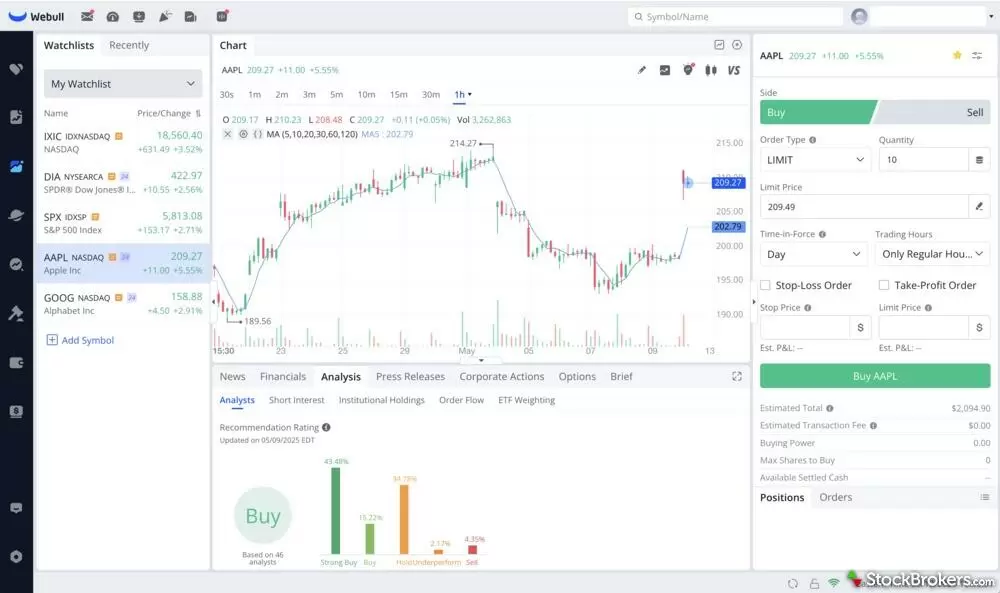
Webull combines commission-free stock trading with built-in charting tools, making it a convenient option for beginners who want to learn, chart, and trade all in one mobile app. The charts include basic indicators like moving averages, RSI, MACD, and volume. Paper trading is available so you can practice without risking real money.
However, Webull's charting tools are clearly secondary to its brokerage function. The indicator selection is limited, drawing tools are basic (and awkward to use on a phone), and there is no AI assistance, no pattern recognition, and no advanced analysis features. If your primary goal is learning to read charts, you will outgrow Webull's charting capabilities relatively quickly.
Pros
- Commission-free trading built in
- Paper trading for practice
- Clean mobile interface
- Free real-time data
Cons
- Limited indicator selection
- Basic drawing tools
- No AI features or pattern recognition
- Charting is secondary to brokerage
4. Yahoo Finance
Yahoo Finance is where many people first encounter a stock chart. The platform offers basic price charts with a handful of overlay indicators. It requires no account, loads fast, and provides good financial news coverage. For a quick check on a stock price or a glance at a simple chart, it does the job.
As a learning tool for chart analysis, Yahoo Finance falls short. There are no drawing tools (no trendlines, no Fibonacci retracements), you cannot save chart layouts, and the technical indicator selection is minimal. There is no AI, no pattern recognition, and the data can be delayed. It is a good first step for someone who has never looked at a stock chart before, but you will need to move to a dedicated stock chart analysis tool once you start learning technical analysis in any meaningful way.
Pros
- No account required
- Fast and accessible
- Good news coverage
- Widely recognized brand
Cons
- No drawing tools
- Very limited indicators
- Cannot save layouts
- Heavy advertising
- No AI or pattern recognition
Reading Crypto Charts vs Stock Charts
If you are interested in the best charts for crypto trading, you will be glad to know that the core skills covered in this guide apply directly to crypto. Candlestick patterns, support and resistance, technical indicators, and chart patterns all work the same way whether you are looking at Apple stock or Bitcoin. The underlying math does not change. However, there are several important differences between the two markets that affect how you read and interpret charts.
24/7 Markets Mean No Gaps
Stock markets have opening and closing times, which means there are gaps between trading sessions. These gaps can create patterns (like gap ups and gap downs) that carry analytical significance. Crypto markets trade around the clock, seven days a week, so gaps are extremely rare. This means patterns that rely on gaps, such as gap-and-go strategies, do not translate well from stocks to crypto.
Higher Volatility Requires Wider Stops
Crypto assets are significantly more volatile than most stocks. Bitcoin routinely moves 3 to 5 percent in a single day, and altcoins can swing 10 to 20 percent or more. This means that the same indicators may need different parameter settings. For example, Bollinger Bands on a crypto chart will naturally be wider than on a blue-chip stock chart. RSI overbought and oversold thresholds may need adjustment. Support and resistance levels can be tested and broken more violently. Beginners moving from stocks to crypto should widen their mental framework for what constitutes "normal" price movement.
Social Sentiment Plays a Bigger Role
While both stock and crypto prices are influenced by sentiment, crypto markets are disproportionately affected by social media, influencer statements, and viral narratives. A single tweet can move a cryptocurrency by double digits. This means that chart patterns in crypto can be invalidated by external events more frequently than in stocks. It is essential to combine technical analysis with an awareness of the broader sentiment landscape when trading crypto.
Volume and Liquidity Vary Wildly
Major stocks like Apple or Microsoft have deep, consistent liquidity. Most cryptocurrencies, especially altcoins, have much thinner order books. This means that support and resistance levels on crypto charts can be broken through more easily by a single large order, and that volume spikes may be more exaggerated. Always verify that the crypto you are charting has sufficient daily volume to make technical analysis meaningful.
Choosing the Right Crypto Charting Platform
For the best charts for crypto trading, you need a platform that supports both stocks and crypto in one place, offers real-time crypto data, and includes the full range of technical indicators. ChartingLens supports both asset classes on the same platform with the same suite of 40+ indicators, AI features, and drawing tools, making it easy to switch between markets without switching apps. TradingView also supports crypto charting, though the free tier limitations still apply.
Common Mistakes Beginners Make Reading Charts
Even with a solid understanding of charts, patterns, and indicators, beginners consistently fall into the same traps. Being aware of these mistakes can save you from costly errors.
1. Overloading the chart with indicators. Adding every available indicator to your chart does not give you an edge. It gives you contradictory signals and analysis paralysis. Most professional traders use three to five indicators at most, chosen to complement each other. Start simple and add complexity only when you understand what each indicator is telling you and why.
2. Ignoring timeframe context. A bullish signal on a 5-minute chart means very little if the daily chart is in a strong downtrend. Always start with a higher timeframe to understand the big picture before analyzing lower timeframes for entry points. If the daily trend is bearish, be cautious about taking bullish signals on the 1-hour chart.
3. Seeing patterns that are not there. Once you learn about chart patterns, your brain will start seeing them everywhere, even in random noise. A valid head and shoulders requires clear, proportional peaks and a well-defined neckline. A vaguely "head-shaped" price formation does not count. Be disciplined about what qualifies as a valid pattern. This is where AI pattern recognition tools can help keep you honest.
4. Ignoring volume. A breakout above resistance on low volume is suspect. A reversal candle on low volume may not follow through. Always check whether volume confirms the price action you are seeing. High volume validates the signal; low volume suggests it may be a false move.
5. Trading based on a single indicator or pattern. No single indicator is right all the time. RSI can stay overbought for weeks during a strong trend. MACD can give false crossover signals in choppy markets. The most reliable signals come from confluence: multiple indicators and chart elements pointing in the same direction at the same time. For example, a hammer candlestick at a support level with RSI in oversold territory and rising volume is a much stronger signal than any one of those factors alone.
6. Not having a plan before looking at the chart. If you open a chart without knowing what you are looking for, you will find reasons to both buy and sell. Decide what conditions would make you bullish or bearish before you analyze. For example: "I am looking for a pullback to the 50-day SMA with RSI near 40 and a bullish candlestick for an entry." This keeps your analysis objective rather than emotional.
7. Confusing correlation with causation. Just because the price moved up after a certain pattern formed in the past does not guarantee it will do so again. Chart patterns are probabilistic, not deterministic. Always use proper risk management (stop-loss orders, position sizing) regardless of how "perfect" a setup looks.
Frequently Asked Questions
Start Reading Charts with Confidence
Learning how to read stock charts is one of the most valuable skills you can develop as a trader or investor. It does not happen overnight, but the building blocks are simpler than most people think. Start with candlestick charts. Learn to identify support and resistance levels. Add a couple of indicators like moving averages and RSI. Look for basic patterns like double bottoms and triangles. And always, always check volume.
The tools available today make this journey far easier than it was even a few years ago. You no longer have to figure everything out alone by staring at charts and guessing. AI-powered platforms can explain what you are seeing, detect patterns automatically, and surface high-probability setups across thousands of stocks. The best approach is to combine your own developing skills with technology that accelerates your learning.
Whether you are charting stocks, crypto, or both, the principles in this guide give you a solid foundation. The next step is to open a chart and start practicing. Every candle you analyze, every support level you identify, and every pattern you spot builds the intuition that separates informed traders from those who are just guessing.
Related Articles
Start Learning with AI-Powered Charts
Free live charts, 40+ indicators, AI pattern recognition, and an AI assistant that explains everything as you learn. No credit card required.
Try ChartingLens Free