Supply and demand zones are one of the most powerful concepts in technical analysis. Unlike traditional indicators that lag behind price, supply and demand zones reveal where institutional money has entered the market, giving you a forward-looking framework for identifying high-probability trade entries before price reacts.
Whether you trade stocks, forex, or crypto, understanding how to find supply and demand zones and trade them correctly can fundamentally change your results. This guide covers everything from the core theory behind supply and demand trading to step-by-step instructions for drawing zones, building a supply and demand strategy, and using AI to detect these zones automatically.
What Are Supply and Demand Zones?
A supply zone is a price area where selling pressure overwhelmed buying pressure, causing price to drop sharply. It represents a region where institutional sellers placed large sell orders. When price returns to a supply zone, those unfilled sell orders can trigger another decline.
A demand zone is the opposite: a price area where buying pressure overwhelmed selling pressure, causing price to rally sharply. It represents a region where institutional buyers accumulated positions. When price revisits a demand zone, those unfilled buy orders can trigger another rally.
The key distinction is that supply and demand zones are areas, not lines. They represent a range of prices where institutional activity occurred, typically visible as a consolidation or basing pattern before an impulsive move. This is different from a single support or resistance level, which marks one specific price point.
Key concept: Supply and demand zones are created by institutional order flow. Large players (banks, hedge funds, pension funds) cannot fill their entire position at one price. They accumulate or distribute over a range, leaving behind a "footprint" on the chart. When price returns to that range, the remaining unfilled orders can move the market again.
In the context of smart money concepts, supply and demand zones are foundational. They sit alongside order blocks and fair value gaps as core tools for understanding where institutional money is positioned. While order blocks focus on the last candle before an impulsive move and fair value gaps identify imbalances in price delivery, supply and demand zones capture the entire accumulation or distribution area.
The Four Types of Supply and Demand Zones
Supply and demand zones are classified by the price action that forms them. Understanding the four types helps you assess the strength of each zone:
- Rally-Base-Drop (RBD): Price rallies into an area, consolidates (the base), then drops sharply. This forms a supply zone. The base is where sellers accumulated their short positions.
- Drop-Base-Rally (DBR): Price drops into an area, consolidates (the base), then rallies sharply. This forms a demand zone. The base is where buyers accumulated their long positions.
- Rally-Base-Rally (RBR): Price rallies, pauses to consolidate, then continues rallying. The base forms a demand zone (a continuation demand zone). Buyers re-accumulated during the pause.
- Drop-Base-Drop (DBD): Price drops, pauses to consolidate, then continues dropping. The base forms a supply zone (a continuation supply zone). Sellers re-distributed during the pause.
Reversal zones (RBD and DBR) tend to be stronger than continuation zones (RBR and DBD) because they represent a complete change in market direction driven by heavy institutional activity.
Why Supply and Demand Zones Work in Trading
Supply and demand zones are not just another technical analysis tool built on historical price patterns. They work because they reflect the mechanics of how large institutions execute orders in financial markets. Understanding this is essential for using supply and demand trading effectively.
Institutional Order Flow Cannot Be Hidden
When a hedge fund wants to buy $500 million worth of a stock, it cannot simply place a single market order. That would move the price against itself massively. Instead, the fund breaks the order into smaller pieces and executes them over a range of prices and over time. This creates a visible "footprint" on the chart in the form of a consolidation or basing pattern.
After the fund has accumulated enough of its position, the buying pressure tips the balance and price moves impulsively away from the zone. But here is the critical insight: the fund rarely fills its entire order in one pass. The remaining unfilled orders sit at the original accumulation prices. When price returns to that zone, those orders get triggered, which can produce another move in the same direction.
The Concept of Unfilled Orders
This is why fresh supply and demand zones (zones that have not been retested) produce the strongest reactions. The first time price returns to a zone, the maximum number of unfilled institutional orders remains. Each subsequent test absorbs more of those orders, weakening the zone. By the third or fourth retest, most of the institutional orders have been filled, and the zone is likely to break.
Why Price Moves Impulsively From Zones
The strength of the move away from a zone tells you about the intensity of the institutional activity. A strong, impulsive move (large candles with little overlap) indicates aggressive buying or selling. A weak move (small candles, lots of wicks) suggests less conviction. The stronger the departure from the zone, the more likely the zone will hold when retested.
This is also why supply and demand zones work across all markets and timeframes. The underlying mechanics are the same whether you are trading supply and demand in forex, stocks, crypto, or commodities. Institutional players are present in all liquid markets, and their order flow creates the same patterns. The key difference is that higher timeframes (daily, weekly) capture larger institutional positions and produce more reliable zones.
How to Identify Supply Zones on a Chart
A supply zone forms when price consolidates in a narrow range and then drops sharply. The consolidation area is the zone itself, representing where institutional sellers built their short positions or distributed their long positions. Here is how to find supply zones on any chart:
Step 1: Find a Strong Bearish Move
Start by scanning the chart for strong downward moves. You are looking for impulsive bearish candles with large real bodies and minimal wicks. These moves represent aggressive institutional selling. The stronger and faster the move, the more significant the supply zone above it.
Step 2: Trace Back to the Origin
Once you have identified a strong bearish move, trace the price action backward to find where the move originated. You are looking for the consolidation, base, or the last bullish candle before the drop. This is where institutional sellers placed their orders.
Step 3: Identify the Base (Consolidation)
The base typically consists of one or more candles with small bodies that traded within a tight range before the impulsive drop. In an RBD (Rally-Base-Drop) pattern, you will see price rally into the zone, consolidate for a few candles, and then drop aggressively. In a DBD (Drop-Base-Drop) pattern, price drops, pauses, then continues dropping.
Step 4: Confirm the Move Away Is Impulsive
The move away from the zone must be impulsive, meaning it consists of large-bodied candles that cover significant price distance relative to the consolidation range. A general guideline: the impulsive move should be at least 2-3 times the height of the base. If the move away is weak or gradual, the zone is less reliable.
Supply zone checklist: (1) Clear consolidation or basing area, (2) strong impulsive bearish move away, (3) the move is at least 2-3x the height of the base, (4) the zone has not been retested more than once or twice. Fresh, untested supply zones are the highest probability.
How to Identify Demand Zones on a Chart
Demand zones are the mirror image of supply zones. They form when price consolidates in a narrow range and then rallies sharply. The process for identification follows the same logic, inverted:
Step 1: Find a Strong Bullish Move
Scan for impulsive bullish candles with large real bodies and minimal upper wicks. These represent aggressive institutional buying. The more explosive the rally, the more significant the demand zone below it.
Step 2: Trace Back to the Origin
Look backward from the start of the bullish impulse. Find where price based, consolidated, or where the last bearish candle occurred before the rally began. This is the accumulation area where institutional buyers built their positions.
Step 3: Define the Accumulation Base
In a DBR (Drop-Base-Rally) pattern, price drops into the area, consolidates with small-bodied candles, and then explodes upward. In an RBR (Rally-Base-Rally) pattern, price rallies, pauses for accumulation, and then continues higher. The entire range of the consolidation candles forms the demand zone.
Step 4: Validate the Departure Strength
The bullish move away from the zone should be strong and impulsive. Look for marubozu or large-bodied bullish candles that close near their highs. The impulsive move should cover at least 2-3 times the height of the base. Weak, grinding rallies from a zone suggest less institutional conviction and a lower probability of the zone holding on a retest.
Both volume analysis and the quality of the candlestick patterns at the zone provide additional confirmation. High volume at the base confirms institutional participation, while low volume during the impulsive move suggests that opposing orders have been cleared and the path of least resistance favors the direction of the move.
How to Draw Supply and Demand Zones (Step-by-Step)
Knowing how to draw supply and demand zones correctly is where most traders struggle. Draw the zone too tight and you will get stopped out before the reaction. Draw it too wide and your risk-reward ratio deteriorates. Here is a precise, repeatable method for drawing supply and demand zones on any chart.
Drawing a Supply Zone
- Identify the base candles: Find the consolidation candles before the impulsive bearish move. These are typically candles with small bodies that overlap with each other.
- Mark the upper boundary: Place the top of your zone at the highest wick of the base candles. This captures the maximum price reached during the consolidation, where some institutional orders may have been placed.
- Mark the lower boundary: Place the bottom of your zone at the lowest body of the base candles. Some traders use the lowest wick, but the body is a more conservative and precise boundary.
- Extend the zone to the right: Draw the rectangle forward in time so the zone remains visible as price develops. When price returns to this zone, it is your area of interest.
- Label the zone: Mark it as a supply zone so you do not confuse it with demand zones later. Note whether it is fresh (untested) or has been retested.
Drawing a Demand Zone
- Identify the base candles: Find the consolidation candles before the impulsive bullish move.
- Mark the lower boundary: Place the bottom of your zone at the lowest wick of the base candles.
- Mark the upper boundary: Place the top of your zone at the highest body of the base candles.
- Extend the zone to the right: Draw the rectangle forward so the zone stays visible on the chart.
- Label and track freshness: Note whether the zone is fresh or has been tested.
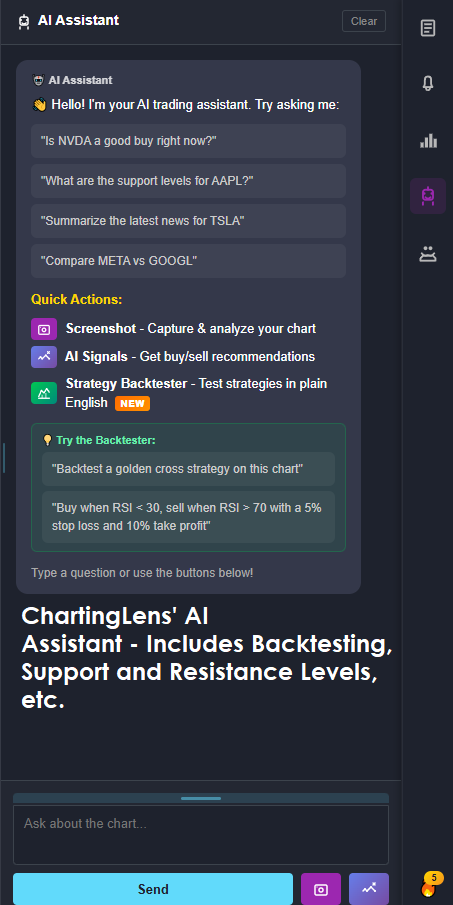
Pro tip: In ChartingLens, the AI Chat can draw supply and demand zones for you automatically. Simply type "show me supply and demand zones" or "detect supply and demand on this chart" and the AI identifies the zones, draws them as locked rectangles anchored to price and time, and labels them. This eliminates the subjectivity of manual drawing and saves significant time.
Common Drawing Errors to Avoid
- Zones that are too wide: If your zone spans more than 3-5% of price, it is likely too wide. Narrow it by using candle bodies instead of wicks for your boundaries.
- Including the impulsive candle in the zone: The zone is only the base (consolidation). Do not extend the zone to include the large bearish or bullish candle that departed from the base.
- Drawing zones from every minor consolidation: Not every pause in price is a supply or demand zone. The departure must be impulsive and significant. Weak moves away from a consolidation do not qualify.
How to Trade Supply and Demand Zones
Identifying and drawing supply and demand zones is only half the equation. The other half is building a supply and demand strategy that defines your entries, stops, targets, and risk management. Here are the primary approaches traders use.
Strategy 1: The Fresh Zone Retest Entry
This is the most common and highest-probability supply and demand strategy. You wait for price to return to a fresh (untested) zone and enter a trade in the direction of the original impulsive move.
- For demand zones (long): Wait for price to drop back into a fresh demand zone. Enter long when price touches the upper boundary of the zone or shows a bullish rejection candle (pin bar, engulfing) within the zone. Place your stop loss below the lower boundary of the zone. Target the next supply zone above or a measured move based on risk-reward.
- For supply zones (short): Wait for price to rally back into a fresh supply zone. Enter short when price touches the lower boundary of the zone or shows a bearish rejection candle within the zone. Place your stop loss above the upper boundary of the zone. Target the next demand zone below.
Strategy 2: Zone-to-Zone Trading
In this approach, you trade from one zone to the next. Enter at a demand zone, set your target at the nearest supply zone above. Enter at a supply zone, set your target at the nearest demand zone below. This strategy works well in ranging or choppy markets where price oscillates between clearly defined zones.
Strategy 3: Breakout Confirmation
When price breaks through a supply or demand zone with strong momentum, it signals that the zone has been absorbed and the trend is likely to continue. You can enter in the direction of the breakout, using the broken zone as your new support (broken supply becomes demand) or resistance (broken demand becomes supply).
Risk Management for Supply and Demand Trading
Regardless of which strategy you use, strict risk management is non-negotiable:
- Stop loss placement: Always place your stop loss on the other side of the zone. For demand zone longs, your stop goes below the zone. For supply zone shorts, your stop goes above the zone. This gives the trade enough room to work while protecting you if the zone fails.
- Position sizing: Size your position so that if your stop is hit, you lose no more than 1-2% of your trading account. The zone width determines your stop distance, which determines your position size.
- Minimum risk-reward: Only take trades with at least a 2:1 reward-to-risk ratio. If the distance to your target is not at least twice the distance to your stop, skip the trade.
You can backtest a strategy based on supply and demand zones using ChartingLens. The plain-English backtester allows you to describe your supply and demand strategy in natural language, and the AI will test it against historical data. This removes guesswork and shows you exactly how your approach would have performed.
Supply and Demand vs. Support and Resistance: Key Differences
Supply and demand zones and support and resistance levels are related concepts, but they are not the same thing. Understanding the differences will help you use both more effectively.
Support and Resistance: Lines at Specific Prices
Traditional support and resistance identifies specific price levels where price has historically bounced or reversed. A support level is a price where buyers have consistently stepped in. A resistance level is a price where sellers have consistently appeared. These are drawn as horizontal lines on the chart.
Supply and Demand: Zones (Areas) of Institutional Activity
Supply and demand zones are price ranges, not single lines. They represent areas where institutional order flow created an imbalance. A demand zone might span $148 to $152, while a support level would be placed at exactly $150. The zone captures the full range of institutional accumulation, giving you more information about where orders are clustered.
Key Differences at a Glance
- Precision: Support/resistance = single line. Supply/demand = price range (zone).
- Origin: Support/resistance is based on historical price touches. Supply/demand is based on the origin of impulsive institutional moves.
- Freshness: Supply and demand zones have a concept of "freshness" (first test is strongest). Support/resistance lines are often considered stronger with more touches, which is the opposite logic.
- Predictive power: Supply and demand zones can be identified before price returns to them. Support/resistance typically requires multiple touches to be confirmed.
- Context: Supply/demand zones incorporate the quality of the move away (impulsive vs. gradual). Support/resistance does not.
Best practice: Use both together. ChartingLens AI detects both support/resistance levels and supply/demand zones, drawing them on the same chart. When a support/resistance level aligns with a supply or demand zone, you have confluence, which significantly increases the probability of a reaction.
Common Mistakes When Trading Supply and Demand
Supply and demand trading is conceptually straightforward but easy to execute poorly. These are the most common mistakes that undermine results.
Mistake 1: Trading Every Zone
Not all supply and demand zones are equal. Zones formed on lower timeframes (1-minute, 5-minute) are weaker and less reliable than zones on the daily or weekly chart. Zones with weak departures (small candles, gradual moves) are less likely to hold. Be selective. Only trade zones with strong impulsive departures on higher timeframes.
Mistake 2: Ignoring Zone Freshness
A supply or demand zone that has been tested three or four times is not the same as a fresh, untested zone. Each test absorbs more of the institutional orders that created the zone. By the third test, the zone is often "spent" and more likely to break. Prioritize fresh zones over retested ones.
Mistake 3: Drawing Zones Too Wide or Too Narrow
If your zone is too wide, your stop loss will be too far away, destroying your risk-reward ratio. If it is too narrow, you risk getting stopped out before the zone reaction occurs. Use the base candle bodies and wicks as your guide, and aim for zones that are proportional to the timeframe you are trading.
Mistake 4: Not Using Confluence
A supply or demand zone on its own provides a trade setup, but confluence with other factors dramatically improves reliability. Look for zones that align with support and resistance levels, order blocks, fair value gaps, round numbers, trendlines, or Fibonacci retracement levels. Volume analysis at the zone adds further confirmation.
Mistake 5: Trading Against the Trend
Supply and demand zones work in both trending and ranging markets, but trading against the dominant trend reduces your win rate significantly. In an uptrend, prioritize demand zones for long entries. In a downtrend, prioritize supply zones for short entries. Only trade counter-trend zones on higher timeframes with very strong evidence of institutional activity.
Mistake 6: No Clear Invalidation Point
Every supply and demand trade must have a clear invalidation level. If price closes decisively beyond the zone boundary (a full candle close beyond the zone, not just a wick), the zone has been broken and the trade thesis is invalid. Do not hold and hope. Exit and move on to the next setup.
How to Detect Supply and Demand Zones Automatically With AI
One of the biggest challenges with supply and demand trading is the subjectivity of zone identification. Two traders looking at the same chart will often draw different zones. This inconsistency can lead to unreliable results. AI-powered detection solves this problem by applying consistent, rule-based algorithms to identify supply and demand zones objectively.
ChartingLens AI Chat: Automated Zone Detection
ChartingLens offers an AI Chat that detects and draws supply and demand zones directly on your chart. The process is simple: open any chart, type a natural language command like "show me supply and demand zones" or "detect supply and demand on this chart", and the AI identifies the key zones based on institutional price action patterns.
The AI draws each zone as a locked rectangle anchored to price and time, so the zones stay fixed on your chart as you scroll, zoom, or change timeframes. Each zone is identified based on the same criteria a skilled manual trader would use: the quality of the base, the strength of the impulsive departure, and whether the zone has been tested.
Combining AI Zones With Other Analysis
The real power of ChartingLens AI comes from combining supply and demand zone detection with other AI-powered features:
- AI support and resistance: Ask the AI to draw both supply/demand zones and support/resistance levels on the same chart. Where they overlap, you have high-confluence areas for entries.
- Order blocks: The AI can detect order blocks alongside supply and demand zones. When an order block sits within a supply or demand zone, the probability of a reaction increases.
- Fair value gaps: Fair value gaps (FVGs) often form during the impulsive move away from a zone. When price returns to fill the FVG within a supply or demand zone, it creates a precise entry point.
- Auto chart pattern detection: ChartingLens detects 13+ chart patterns automatically. When a reversal pattern (double top, head and shoulders) forms at a supply zone, or a bullish pattern (double bottom, inverse head and shoulders) forms at a demand zone, the confluence is significant.
- Natural language backtesting: You can describe a complete supply and demand strategy to the backtester in plain English. For example: "Buy when price retests a fresh demand zone on the daily chart with RSI below 40, sell at the nearest supply zone." The AI will test this against historical data and report the results.
Why AI Detection Outperforms Manual Analysis
Manual zone identification is inherently subjective. Fatigue, confirmation bias, and inconsistent criteria cause traders to miss zones, draw them incorrectly, or see zones that are not truly there. AI detection applies the same criteria every time, across every chart, with zero emotional bias. It also scans multiple timeframes simultaneously and can identify zones that a manual trader might overlook.
This does not mean AI replaces human judgment entirely. You still need to decide which zones to trade, how to manage risk, and how the zones fit into the broader market context. But AI handles the identification and drawing, freeing you to focus on execution and decision-making.
Frequently Asked Questions
Related Articles
Ready to Find Supply and Demand Zones Automatically?
ChartingLens AI detects supply and demand zones, draws them on your chart, and combines them with support/resistance, order blocks, and volume analysis for maximum confluence. Try it free.
Try ChartingLens Free