Choosing the right charting and analysis platform is one of the most consequential decisions a trader can make. The platform you use shapes how you see the market, what data you can access, how quickly you can act on opportunities, and ultimately, how effective your analysis becomes. A platform mismatch can mean missed setups, wasted money on features you do not use, or frustration with limitations that slow you down at the worst possible moment.
If you have spent any time researching trading tools, you have likely encountered the same debates: TradingView vs Thinkorswim for charting depth, TradingView vs Finviz for screening stocks, TradingView vs TrendSpider for automated technical analysis, and TradingView vs Koyfin for fundamental research. These comparisons dominate trading forums, Reddit threads, and YouTube videos because each platform has genuine strengths and real weaknesses that affect different traders in different ways.
The problem with most comparison articles is that they either oversimplify the differences or have an obvious bias toward whichever platform they are affiliated with. In this guide, we take a different approach. We have tested each platform hands-on, evaluated them across consistent criteria, and included honest assessments of where each one falls short. We also include ChartingLens as a newer entrant that addresses gaps the established platforms leave open, particularly around AI-powered analysis and insider trading data.
By the end of this article, you will know exactly which platform fits your trading style, your budget, and your analytical needs. Whether you are a day trader who needs the best platform for technical analysis, a swing trader looking for automated pattern recognition, or a fundamentals-focused investor who wants macro dashboards, this comparison will point you in the right direction.
Scroll horizontally to see all columns →
Feature
TradingView
Thinkorswim
Finviz
TrendSpider
Koyfin
ChartingLens
Primary Strength
Social charting
Options analysis
Stock screening
Auto analysis
Fundamental data
AI + Insider data
Free Tier
Limited
Full (acct req.)
Limited
No free tier
Limited
Generous
Starting Price
$14.95/mo
Free (Schwab acct)
$24.96/mo
$22/mo
$24/mo
$14.99/mo
AI Features
✗
✗
✗
Auto trendlines
✗
AI signals + assistant
Insider Data
✗
✗
Basic
✗
✗
✓
Best For
Community traders
Options traders
Stock screeners
Pattern traders
Fundamental analysts
All-in-one free
Now let us dig into each platform individually. We will cover what it does best, where it struggles, what it costs, and who should use it.
TradingView Deep Dive
TradingViewFree (limited) + from $14.95/mo
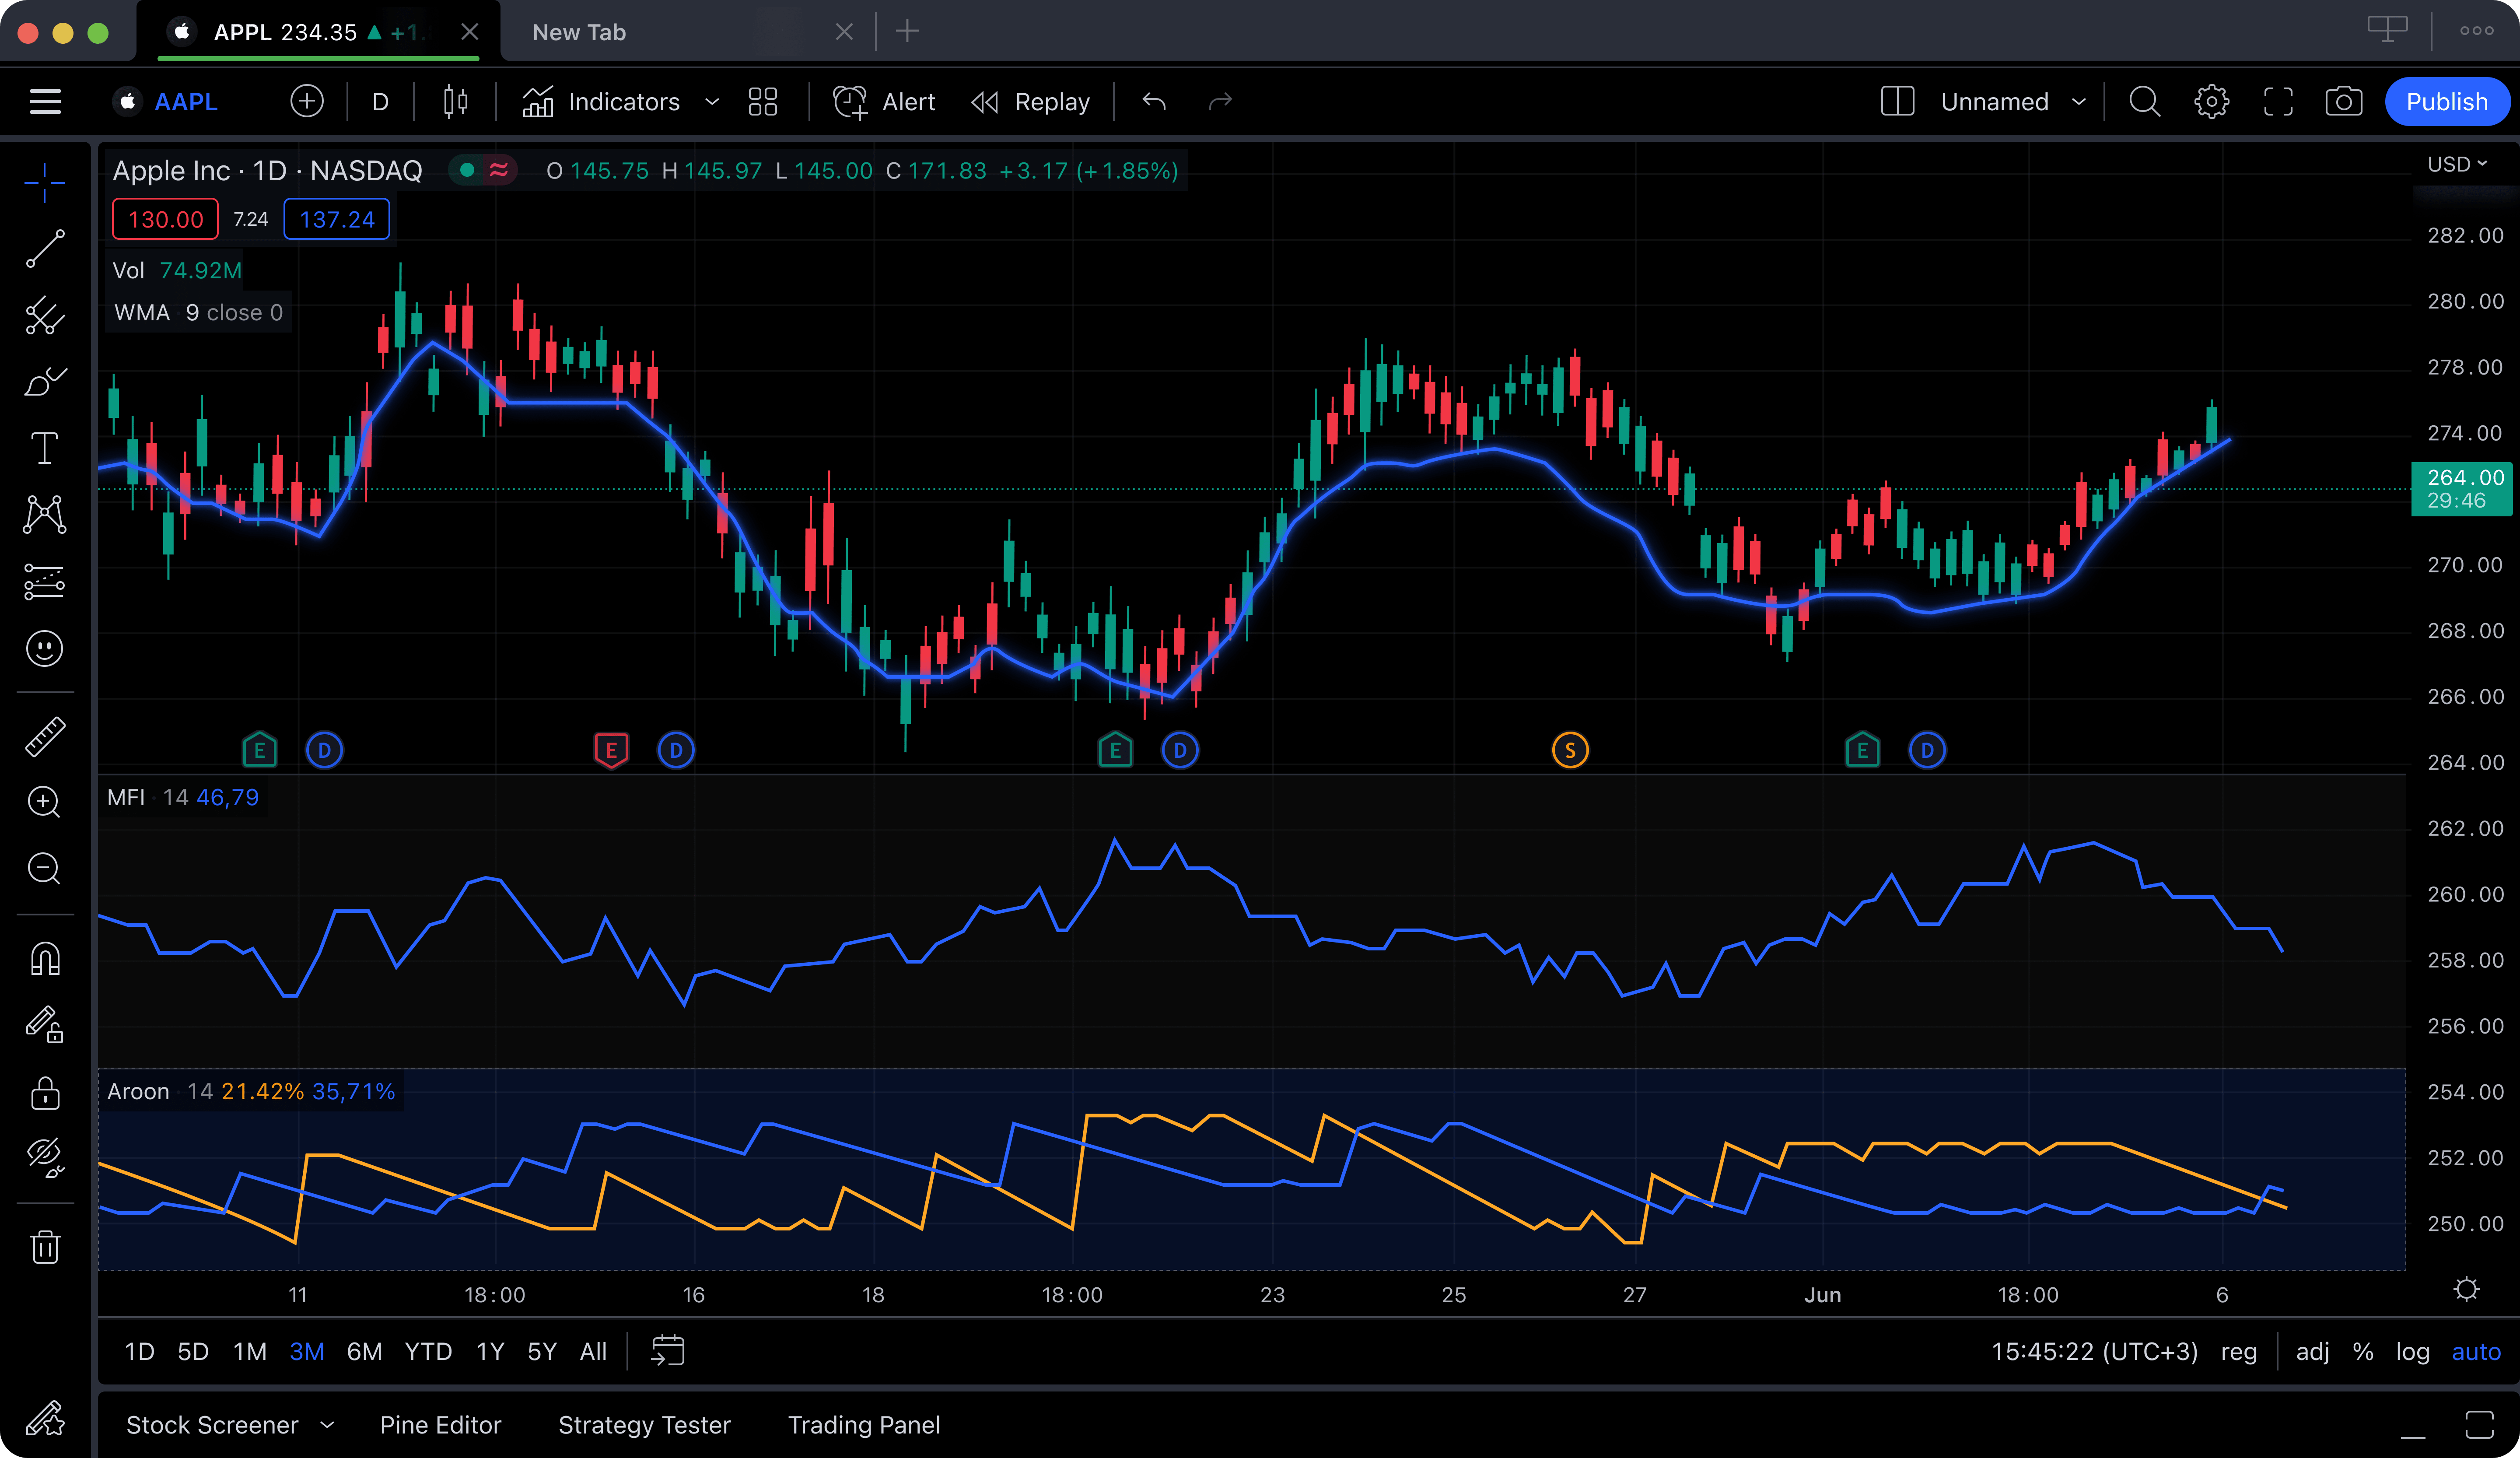
TradingView has become the default name in online charting, and for good reason. Its browser-based platform is fast, visually polished, and packed with features on its paid tiers. The charting engine supports over 100 built-in indicators, 12+ chart types, and a proprietary scripting language called Pine Script that lets you build custom indicators, backtests, and strategies. The social layer, where millions of traders share chart ideas and analyses, is unmatched by any competitor.
TradingView covers an enormous range of asset classes. Stocks, forex, crypto, futures, bonds, and even economic indicators are all accessible from a single interface. The multi-chart layout system lets you monitor several tickers simultaneously, and the alert system (on paid tiers) can notify you by email, app notification, or webhook when specific price or indicator conditions are met. For traders who rely on community insights, the ideas stream provides a constant flow of chart analyses from other users.
The weakness of TradingView lies squarely in its free tier. Free users are limited to a single indicator per chart, one saved chart layout, and one active alert. Ads appear throughout the interface. This means that if your strategy requires even a basic setup of RSI plus a moving average plus MACD, you cannot run it without upgrading. The Essential plan at $14.95 per month (billed annually) unlocks 2 indicators per chart. Most active traders end up on the Plus plan at $29.95 or Premium at $59.95 per month, which adds up to $360 to $720 per year.
TradingView also does not offer AI-powered signals, insider trading data, or hedge fund holdings. Its strength is in traditional charting and social features, not in the kind of alternative data and machine learning analysis that newer TradingView alternatives are bringing to the table. If you compare TradingView vs Thinkorswim, TradingView wins on accessibility and modern design but loses on options depth. If you compare TradingView vs Finviz, TradingView has far superior charting but Finviz has a better stock screener. And if you compare TradingView vs TrendSpider, TradingView offers broader coverage but TrendSpider automates more of the analysis process.
Pros
Largest social trading community
Pine Script for custom indicators and strategies
Covers stocks, crypto, forex, futures, bonds
Polished, fast browser-based interface
Huge indicator library on paid tiers
Powerful alert system with webhooks
Cons
Free tier limited to 1 indicator per chart
Ads on the free plan
Paid plans are expensive ($14.95 to $59.95/mo)
No AI analysis, insider data, or smart money tracking
Pine Script has a learning curve for non-coders
Best for: Traders who value community insights, want Pine Script for custom analysis, and are willing to pay for a full-featured charting experience.
Thinkorswim Deep Dive
Thinkorswim (Schwab)Free with Schwab Account
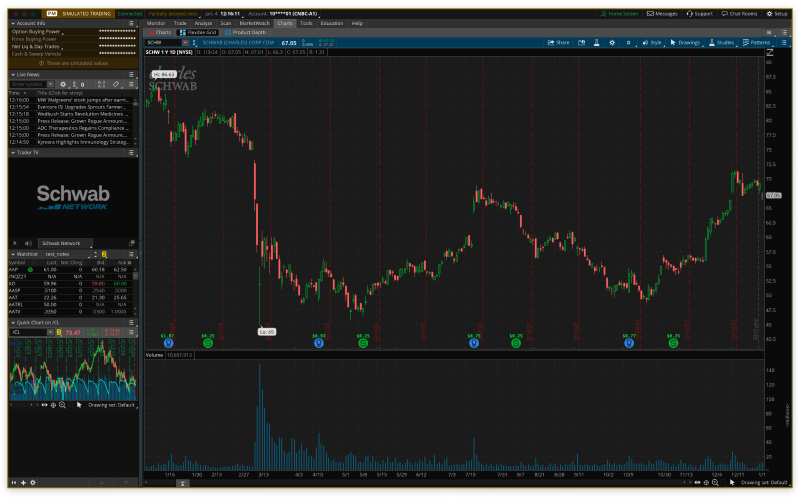
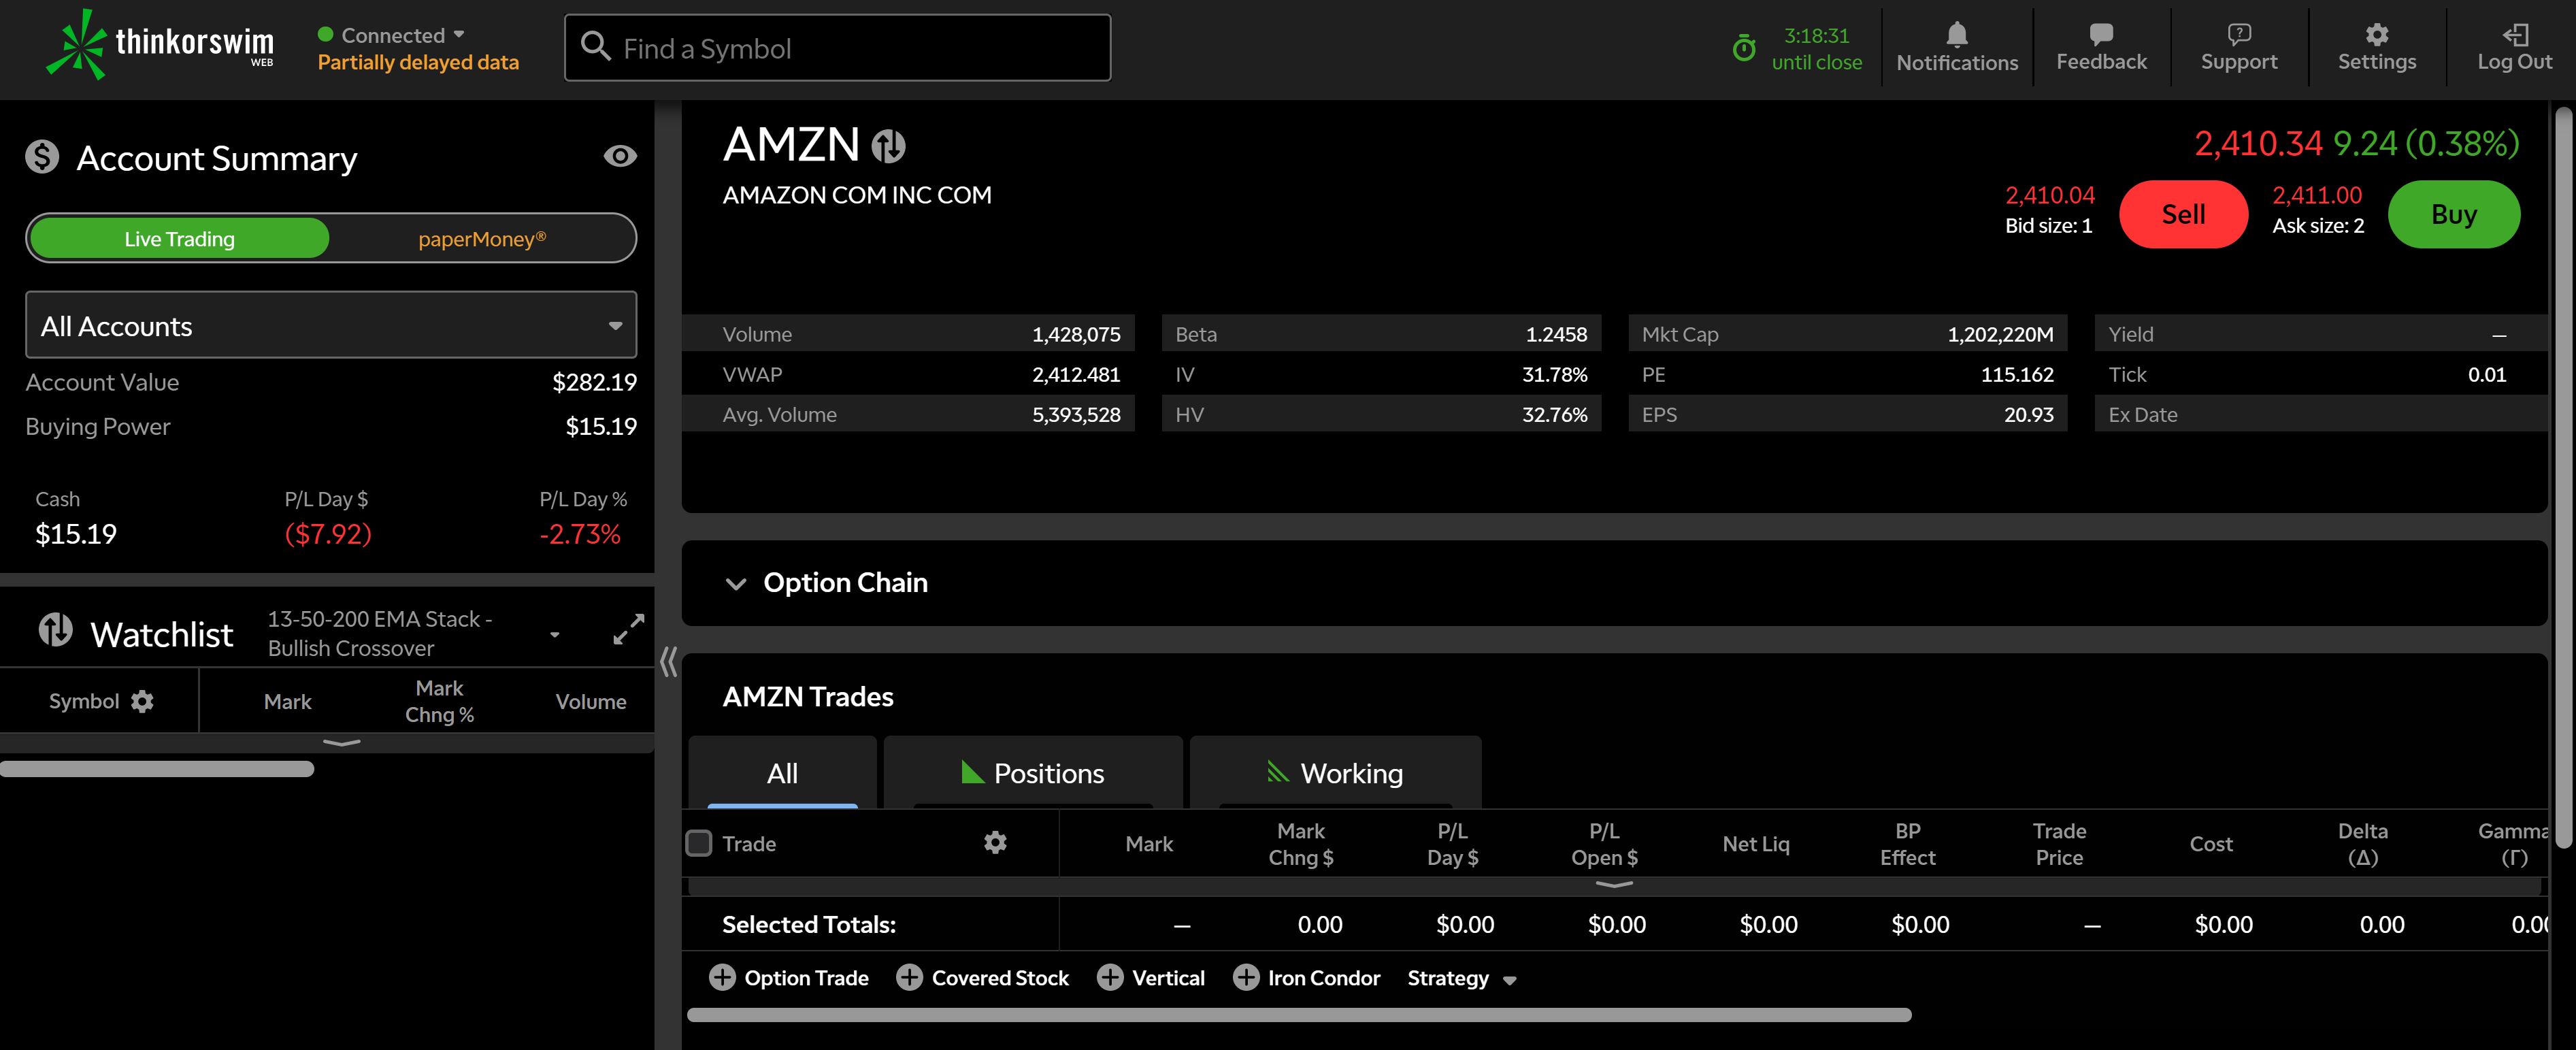
Thinkorswim, originally built by TD Ameritrade and now under the Charles Schwab umbrella, is the most powerful free desktop charting platform available. It was designed for serious traders, and it shows. The platform provides over 400 technical studies, advanced options chain visualization with Greeks analysis, probability cones, a full paper trading simulator with real-time data, and thinkScript, a proprietary programming language for building custom studies and scanners.
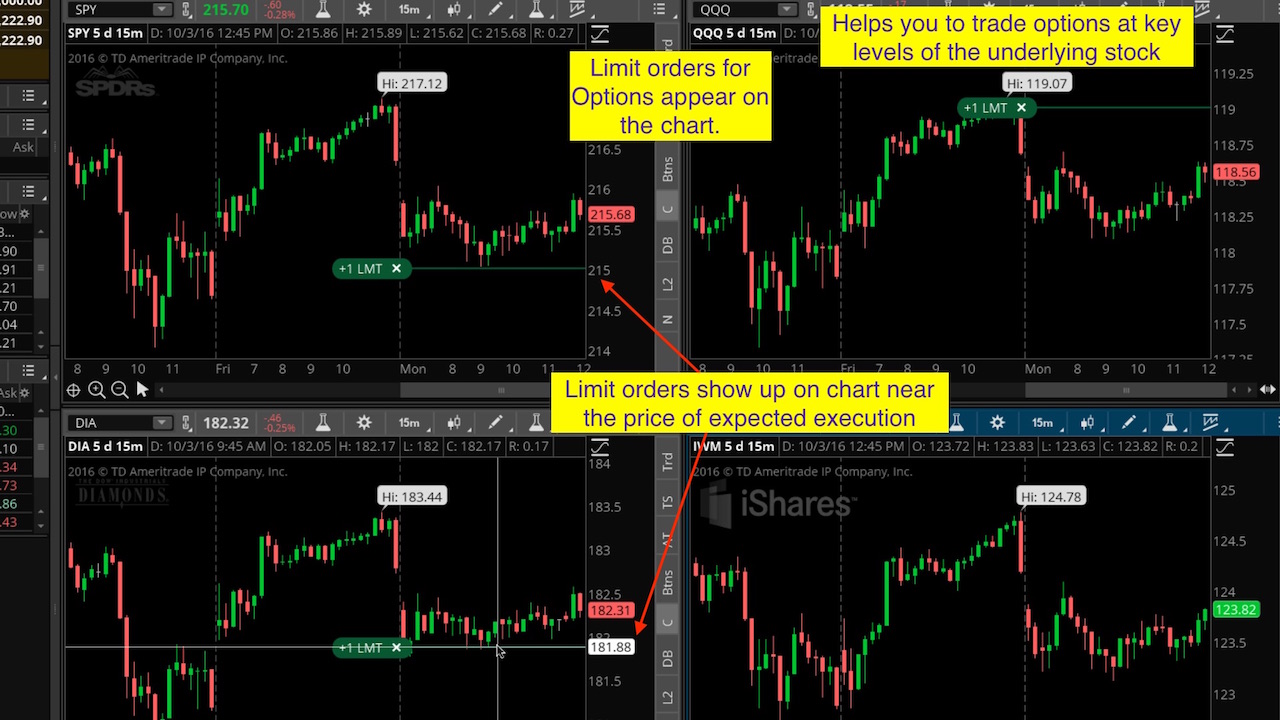
For options traders, Thinkorswim is in a league of its own among free platforms. The Analyze tab lets you model complex multi-leg options strategies, visualize profit-and-loss curves at different expirations and implied volatility levels, and assess probability of profit before placing a trade. The risk profile tools show exactly how changes in the underlying price, time decay, and volatility will affect your position. No other free platform offers this depth of options analysis.
The trade-offs are significant, however — and they are driving traders to explore thinkorswim alternatives. Thinkorswim requires opening a Charles Schwab brokerage account, so it is not a standalone charting tool. The desktop application is resource-heavy and can feel sluggish on older machines. The interface is dense and intimidating, with a learning curve that can take weeks or months to master. The web and mobile versions exist but sacrifice many of the advanced features that make the desktop version compelling. There are no AI-powered features, no insider trading data overlays, and the social and community features are minimal.
In the TradingView vs Thinkorswim debate, the answer depends entirely on what you trade. If you are primarily a stock or crypto trader who values modern design and community, TradingView wins. If you trade options and need probability analysis, strategy modeling, and real-time paper trading, Thinkorswim is the clear choice. Neither platform offers the AI signals or insider data that newer tools like ChartingLens provide.
Pros
400+ technical studies included free
Best-in-class options analysis tools
Paper trading simulator with live data
thinkScript custom programming language
Advanced scanning and backtesting
Completely free with a Schwab account
Cons
Requires a Schwab brokerage account
Steep learning curve, intimidating for beginners
Desktop app is resource-heavy and feels dated
Web and mobile versions are significantly limited
No AI features or insider trading data
Minimal community or social features
Best for: Options traders and advanced users who want institutional-grade analysis tools at no cost through a Schwab brokerage relationship.
Finviz Deep Dive
FinvizFree (limited) + $24.96/mo Elite
Finviz, short for Financial Visualizations, has earned its reputation as one of the best stock screeners on the web. The platform excels at letting traders quickly filter through thousands of stocks using a combination of fundamental criteria (P/E ratio, market cap, dividend yield), technical criteria (RSI, moving average crossovers, price patterns), and descriptive filters (sector, industry, country). The visual heat map that shows market performance at a glance is iconic and widely used across the trading community.
Where Finviz falls short is in the actual charting experience. The charts on Finviz are static images, not interactive charts. You cannot zoom in on a time range, draw trendlines, add multiple indicators, or customize the chart display in any meaningful way. The free tier shows delayed data (20 minutes for US stocks) and limits access to certain screening filters. The Elite plan at $24.96 per month unlocks real-time data, intraday charts, advanced screening, backtesting, and some insider trading data, but the charting tools remain basic compared to dedicated platforms.
Finviz also provides a useful insider trading section and institutional ownership data on individual stock pages, which is more than TradingView or Thinkorswim offer. However, this data is presented in simple tables rather than being integrated into the charting experience. There are no AI features, no drawing tools, and no alert system on the free tier.
When comparing TradingView vs Finviz, these are fundamentally different tools. Finviz is a screener that helps you find stocks worth analyzing. TradingView is a charting platform where you perform the actual analysis. Many traders use Finviz to generate a watchlist and then switch to a charting platform for deeper work. If you want screening and charting in one place with AI signals on top, ChartingLens combines these capabilities more seamlessly.
Pros
One of the best stock screeners available
Iconic heat map for market visualization
Combines fundamental and technical filters
Basic insider trading data on stock pages
Fast and lightweight, no account required for basic use
Cons
Charts are static images, not interactive
No drawing tools, no indicator customization
Free tier uses delayed data (20 min)
Elite plan at $24.96/mo is expensive for a screener
No AI features or automated analysis
Not a replacement for a dedicated charting platform
Best for: Traders who need a powerful stock screener to filter ideas before performing analysis on a separate charting platform.
TrendSpider Deep Dive
TrendSpiderFrom $22/mo (no free tier)
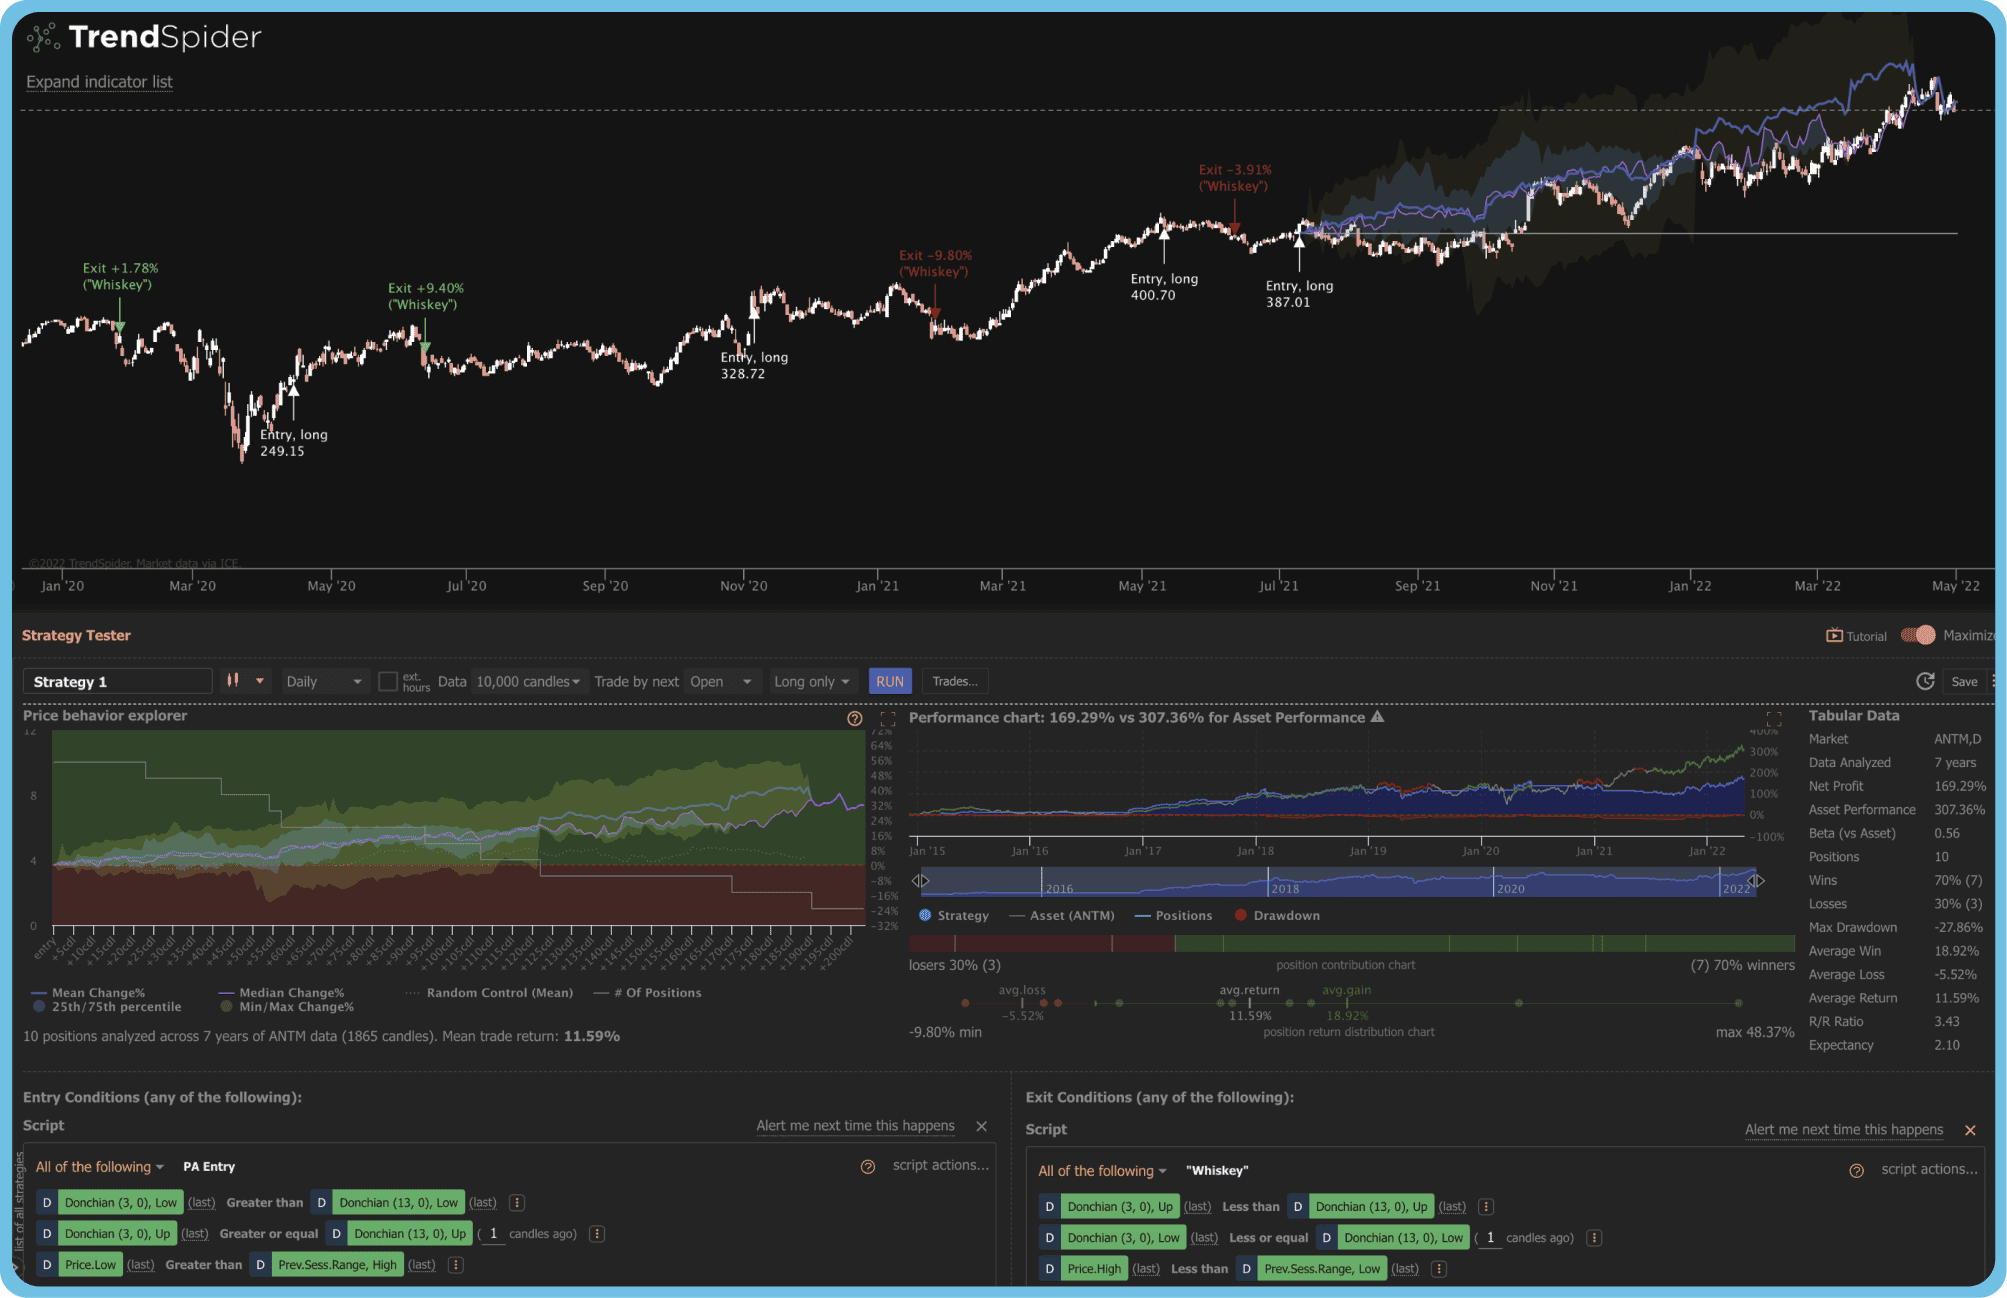
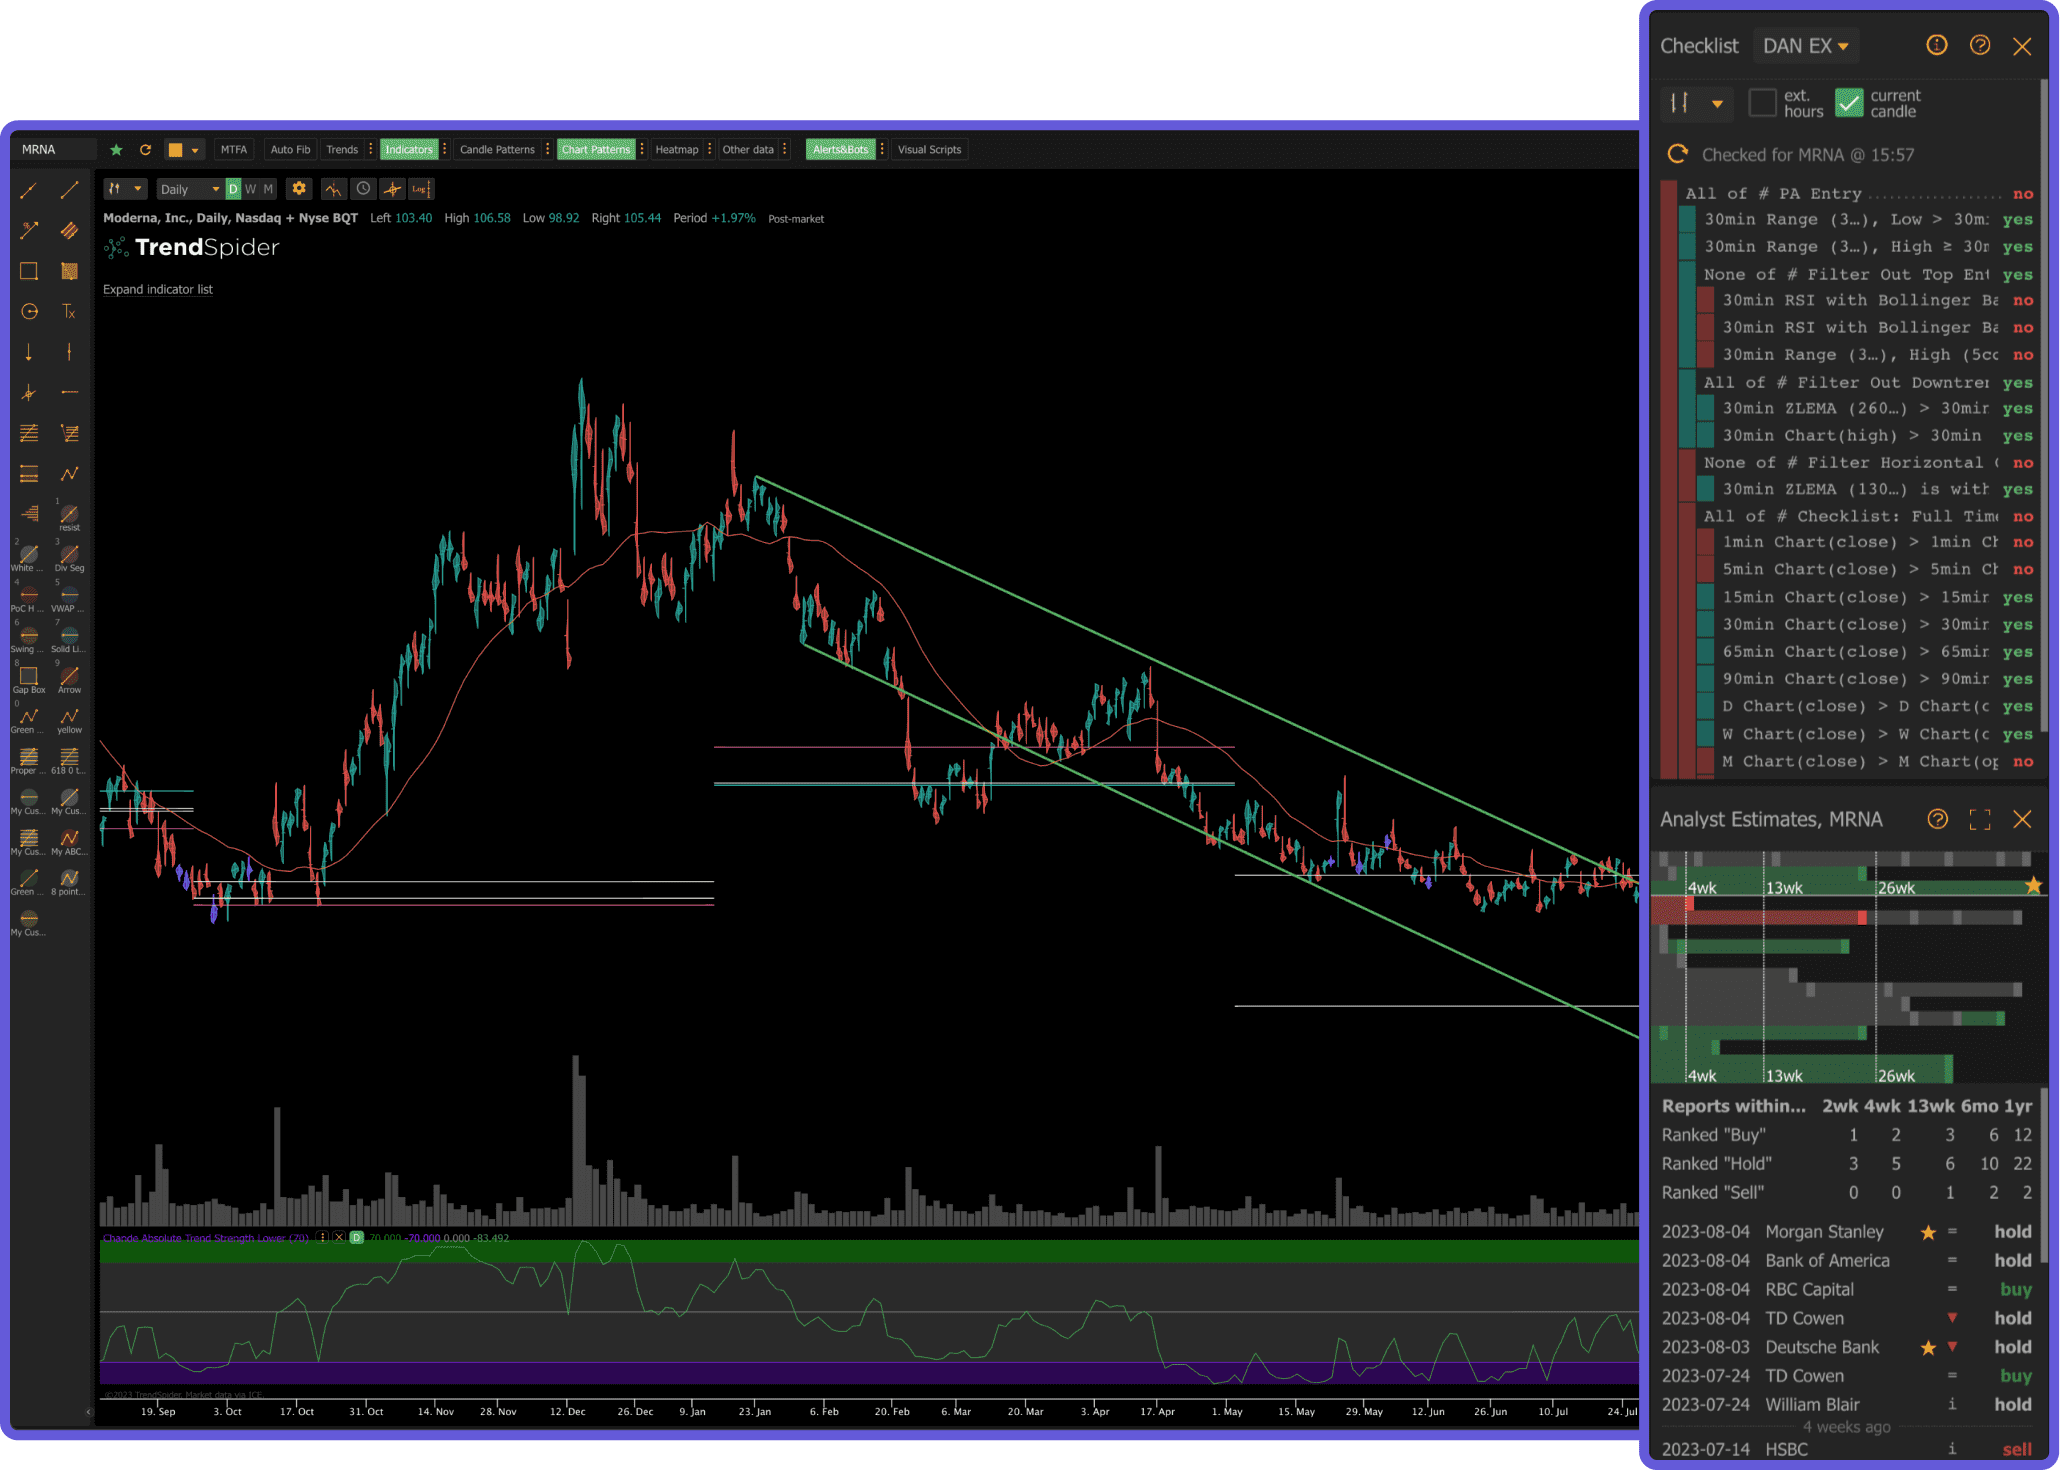
TrendSpider takes a different approach to technical analysis by automating much of the manual work that traders traditionally do by hand. The platform's signature feature is automated trendline detection: instead of drawing trendlines manually, TrendSpider's algorithm scans the chart and draws them for you, identifying support and resistance levels, channels, and chart patterns automatically. It also offers multi-timeframe analysis on a single chart, showing you how trendlines and levels align across different time frames simultaneously.
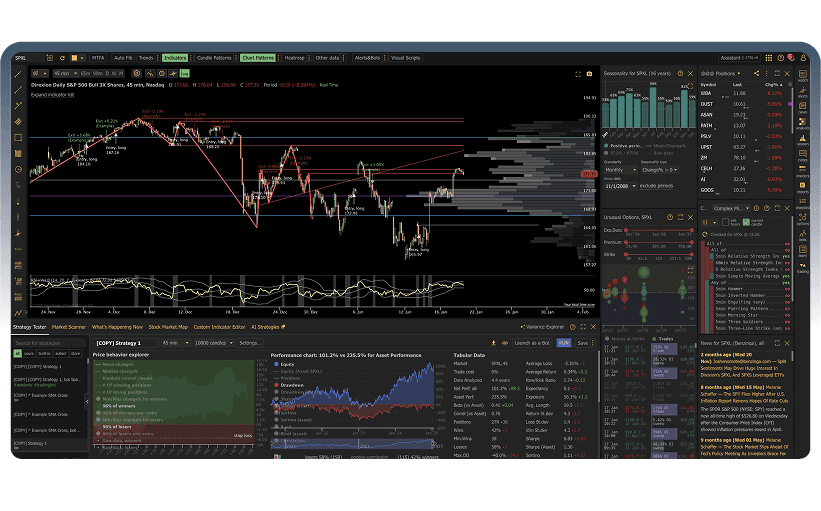
Beyond automated trendlines, TrendSpider provides dynamic price alerts that can trigger based on indicator conditions or trendline breaks, a strategy backtesting engine, and a market scanner that finds stocks matching specific technical setups. The Raindrop Charts feature, unique to TrendSpider, visualizes volume distribution within each candle to show where the most trading activity occurred at each price level. These features make TrendSpider particularly appealing to pattern-focused traders who rely heavily on support and resistance, trendlines, and multi-timeframe confluence.
The major downside is price and accessibility. TrendSpider has no free tier at all. The cheapest plan starts at $22 per month (billed annually), and the most popular plan with all features runs $44 per month. The interface, while powerful, can feel cluttered because the automated analysis layers so much information onto the chart simultaneously. There is no social community, no insider data, and the AI features are focused narrowly on pattern recognition rather than broader market analysis. For traders comparing TradingView vs TrendSpider, TradingView offers broader coverage and community at a lower entry price, while TrendSpider offers deeper automation but at a higher cost with no free option.
Pros
Automated trendline and pattern detection
Multi-timeframe analysis on a single chart
Unique Raindrop Charts for volume visualization
Dynamic alerts based on indicator and trendline conditions
Strategy backtesting engine
Cons
No free tier at all
Starting at $22/mo, popular plan is $44/mo
Charts can feel cluttered with automation layers
No social community or idea sharing
No insider data, hedge fund holdings, or AI assistant
Limited to stocks and ETFs (no crypto or forex)
Best for: Pattern-focused technical traders who want automated trendline detection and multi-timeframe analysis and are willing to pay for it.
Koyfin Deep Dive
KoyfinFree (limited) + from $24/mo
Koyfin positions itself as a Bloomberg Terminal alternative for individual investors, and it delivers impressively on that promise for fundamental and macroeconomic analysis. The platform offers comprehensive financial data dashboards, including income statements, balance sheets, cash flow statements, valuation metrics, earnings estimates, and economic indicators. You can build custom dashboards that track dozens of financial metrics across multiple companies simultaneously, making it a powerful research terminal for investors who base their decisions on fundamentals.
Koyfin's charting capabilities are respectable but clearly secondary to its data dashboards. You can chart stock prices with basic technical indicators and overlays, but the charting engine is not as responsive or feature-rich as TradingView's or even Thinkorswim's. There are no drawing tools beyond basic trendlines, no custom scripting, and the indicator library is modest. The real value of Koyfin is in its ability to visualize financial data, compare companies across dozens of fundamental metrics, and monitor macroeconomic trends like interest rates, inflation, and GDP growth.
The free tier is limited: you get basic charting and some dashboard access, but most of the advanced financial data, screening, and customization features require a paid plan starting at $24 per month. For the TradingView vs Koyfin debate, these platforms serve fundamentally different purposes. TradingView is a technical analysis and charting tool. Koyfin is a financial data and research terminal. If you need both technical and fundamental analysis with AI insights layered on top, a platform like ChartingLens covers the charting and AI side while Koyfin covers the deep fundamental data side.
Pros
Excellent fundamental data and financial dashboards
Comprehensive earnings, valuation, and macro data
Custom dashboard builder for multi-company analysis
Bloomberg Terminal alternative at a fraction of the cost
Clean, modern interface for data visualization
Cons
Charting tools are basic compared to dedicated platforms
No drawing tools beyond basic trendlines
No custom scripting language
Free tier is quite limited
No AI features, no insider data integration
Not designed for day trading or active technical analysis
Best for: Fundamental analysts and macro investors who need a Bloomberg-like data terminal without the Bloomberg price tag.
ChartingLens: The Free Alternative Worth Considering
ChartingLensFree + $14.99/mo Premium
After reviewing the five established platforms above, a clear pattern emerges: TradingView locks core features behind expensive paywalls, Thinkorswim requires a brokerage relationship, Finviz is a screener rather than a charting platform, TrendSpider has no free tier, and Koyfin focuses on fundamentals rather than technical analysis. This is where ChartingLens enters the picture as a platform that addresses the gaps these competitors leave open.
ChartingLens is a web-based charting platform with AI at its core. The free tier includes live stock and crypto charts with over 40 technical indicators (RSI, MACD, Bollinger Bands, EMA, SMA, VWAP, Stochastic, and more), with Volume Profile (VRVP) available on Premium, all available simultaneously on a single chart without limitations. Unlike TradingView, there is no indicator-per-chart restriction on the free plan. Unlike Thinkorswim, no brokerage account is required. Unlike TrendSpider, you do not need to pay to get started.
What makes ChartingLens unique among all platforms reviewed here is its combination of AI-powered features and alternative data. The platform offers AI buy signals that scan over 2,000 stocks to identify high-probability setups using machine learning, a conversational AI trading assistant you can ask questions about any stock or chart pattern, automatic pattern recognition that detects formations like head and shoulders, double bottoms, and triangles, and a proprietary CL Score that rates stocks on a data-driven basis. These are not add-ons; they are integrated into the core charting workflow.
On the data side, ChartingLens provides real-time insider trading data showing executive buys and sells alongside your charts, hedge fund holdings that lets you see the holdings of legendary investors like Warren Buffett and Michael Burry, and institutional ownership changes. This kind of alternative data is typically locked behind expensive specialized terminals or scattered across SEC filing websites. Having it integrated directly into your charting experience is a genuine differentiator that none of the five established platforms in this comparison offer at any price tier.
The premium tier at $14.99 per month is the most affordable paid option among all platforms reviewed. It unlocks Volume Profile (VRVP), deeper AI analysis, additional data, and priority features. But the free tier already includes more AI functionality and alternative data than most competitors provide on their highest-paid plans. The interface is clean, modern, and ad-free on every tier. For a deeper look at how AI-assisted analysis works in practice, see our guide to AI-assisted trading.
Pros
40+ indicators with no per-chart limits on free tier
AI buy signals scanning 2,000+ stocks
AI trading assistant for any stock or chart question
Volume Profile (VRVP) on Premium at $14.99/mo (TradingView: $29.95+/mo)
Real-time insider trading data and hedge fund holdings
No ads on any tier, no brokerage account required
Most affordable premium at $14.99/mo
Cons
Smaller community than TradingView
No custom scripting language (Pine Script or thinkScript equivalent)
No built-in brokerage or order execution
Newer platform, still building out advanced features
Best for: Traders who want AI-powered analysis, insider trading data, and a generous free tier without paying enterprise prices or opening a brokerage account.
Feature-by-Feature Comparison
Now that we have examined each platform individually, let us compare them directly across the categories that matter most when choosing the best platform for technical analysis.
Charting Quality and Flexibility
For pure charting power, TradingView and Thinkorswim lead the field. TradingView offers 12+ chart types, smooth zooming and scrolling, and a polished browser-based experience. Thinkorswim supports even more chart types and studies on its desktop app, though the interface feels dated. ChartingLens provides a clean, modern charting experience with real-time data and cloud-synced drawing tools. TrendSpider adds automated trendlines but can feel cluttered. Koyfin's charting is functional but basic. Finviz charts are static images with no interactivity.
Winner: TradingView for the broadest, most polished charting. Thinkorswim for sheer depth. ChartingLens for the best free charting experience.
Technical Indicators
Thinkorswim leads with over 400 built-in studies. TradingView's paid tiers give access to hundreds of indicators plus a massive library of community-created Pine Script indicators. ChartingLens includes 15+ of the most-used indicators on its free tier with no restrictions. TrendSpider provides a solid set of indicators plus its proprietary automated analysis. Koyfin and Finviz offer basic indicator sets that are insufficient for serious technical analysis.
Winner: Thinkorswim for volume of built-in indicators. TradingView for community-created indicators. ChartingLens for most indicators available free without restrictions.
Stock Screeners
Finviz is the clear screener champion, with one of the most comprehensive filtering systems for both fundamental and technical criteria. TradingView's screener is solid and integrated into the charting workflow. Thinkorswim offers a powerful scanning engine through thinkScript. TrendSpider provides pattern-based scanning. Koyfin offers fundamental screening. ChartingLens takes a different approach with AI-powered scanning that identifies high-probability setups automatically rather than requiring manual filter configuration.
Winner: Finviz for traditional screening. ChartingLens for AI-driven stock discovery.
AI and Automated Features
This is where the field separates dramatically. ChartingLens leads with AI buy signals, an AI trading assistant, automatic pattern recognition, and a proprietary CL Score. TrendSpider offers automated trendline detection and multi-timeframe analysis. TradingView, Thinkorswim, Finviz, and Koyfin have no AI-powered features. As the market shifts toward AI-assisted trading tools, this gap is becoming increasingly significant.
Winner: ChartingLens for breadth of AI features. TrendSpider for automated technical analysis.
Pricing and Value
Thinkorswim is technically the cheapest option since it is free with a Schwab account, but it requires a brokerage relationship. ChartingLens offers the most generous free tier and the most affordable paid upgrade at $14.99 per month. TradingView's useful paid plans range from $14.95 to $59.95 per month. TrendSpider starts at $22 per month with no free option. Finviz Elite costs $24.96 per month. Koyfin plans start at $24 per month. Over a year, the difference between ChartingLens Premium ($120) and TradingView Plus ($360) is $240, enough to fund a meaningful addition to your trading account.
Winner: ChartingLens for best free-tier value and most affordable premium. Thinkorswim for free access with a brokerage account.
Mobile Experience
TradingView has the strongest mobile app, with a well-designed experience that mirrors much of the desktop functionality. Thinkorswim's mobile app is functional but lacks many desktop features. ChartingLens is fully browser-based and mobile-responsive, working well on phone and tablet browsers. Finviz has a basic mobile site. TrendSpider's mobile experience is limited. Koyfin's dashboards are not optimized for small screens.
Winner: TradingView for dedicated mobile app. ChartingLens for best mobile browser experience.
Scroll horizontally to see all columns →
Category
TradingView
Thinkorswim
Finviz
TrendSpider
Koyfin
ChartingLens
Free Indicators
1 per chart
400+
~5 basic
No free tier
~10
15+ unlimited
AI Buy Signals
✗
✗
✗
✗
✗
✓
AI Chat
✗
✗
✗
✗
✗
✓
Auto Pattern Recognition
✗
✗
✗
✓
✗
✓
Insider Trading Data
✗
✗
Basic (Elite)
✗
✗
✓ Free
Hedge Fund Holdings
✗
✗
✗
✗
✗
✓
Drawing Tools
Advanced
Advanced
✗
✓
Basic
✓
Custom Scripting
Pine Script
thinkScript
✗
✗
✗
✗
Stock Screener
✓
✓
Best-in-class
✓
✓
AI-powered
Social / Community
Largest
✗
✗
✗
✗
✗
Real-Time Data (Free)
✓
✓
Delayed
No free tier
Limited
✓
Options Analysis
Basic
Best-in-class
✗
Basic
✗
✗
No Ads (Free Tier)
✗
✓
✗
No free tier
✓
✓
Mobile Experience
Excellent app
Decent app
Basic site
Limited
Not optimized
Responsive web
Paid Plan From
$14.95/mo
Free (acct req.)
$24.96/mo
$22/mo
$24/mo
$14.99/mo
Which Platform Is Best For You?
The right platform depends on how you trade, what data you need, and how much you are willing to spend. Here is a breakdown by trader type to help you decide.
Day Traders
You need real-time data, fast execution, multiple indicators running simultaneously, and ideally AI-powered scanning to surface intraday opportunities faster than manual analysis. ChartingLens is the top pick for its combination of real-time charts, AI signals, and unlimited free indicators. TradingView (paid) is excellent for Pine Script custom strategies. Thinkorswim is strong if you also trade options intraday and want integrated order execution.
Swing Traders
You need reliable multi-day charting, the ability to identify setups across a large universe of stocks, and data that confirms your thesis. ChartingLens excels here with AI signals for identifying swing setups and insider trading data for smart money confirmation. TrendSpider is valuable for automated trendline and pattern detection on swing time frames. TradingView provides community insights that can supplement your own analysis.
Beginners
You need a clean interface that does not overwhelm you, educational support, and ideally AI assistance to help you learn. ChartingLens offers the most beginner-friendly combination of a simple interface with an AI assistant that can answer questions about any stock or chart. TradingView's community provides educational content through shared ideas. Avoid starting with Thinkorswim or TrendSpider, as their complexity can be discouraging when you are just learning.
Options Traders
Thinkorswim is the undisputed champion for options analysis. Its probability tools, strategy modeling, and Greeks visualization are unmatched by any other free platform. Use ChartingLens alongside it to identify which underlyings have the best setups using AI signals and insider buying data before building options positions in Thinkorswim.
Value and Fundamental Investors
Koyfin is the best platform for deep fundamental analysis, earnings data, and macroeconomic research. Use Finviz to screen for stocks matching your fundamental criteria. Then use ChartingLens for timing your entries with technical analysis and checking whether insiders and hedge fund managers are aligned with your thesis through its insider trading and hedge fund holdings features.
Pattern and Technical Analysis Purists
If your strategy revolves around chart patterns, trendlines, and multi-timeframe analysis, TrendSpider offers the most automation in this category with its auto trendline detection. TradingView provides the deepest manual charting tools and Pine Script for custom analysis. ChartingLens adds AI-driven auto pattern recognition on its free tier, making it a cost-effective complement to either platform.
Budget-Conscious Traders
If cost is your primary constraint, ChartingLens delivers the most feature-rich free tier among all platforms compared here. You get 40+ indicators, AI signals, an AI assistant, insider data, and hedge fund holdings without paying anything. If you eventually upgrade, the $14.99 per month premium is less than half the price of TradingView's cheapest useful plan and less than half of Finviz Elite, TrendSpider, or Koyfin.
Frequently Asked Questions
It depends on your trading style. TradingView offers a more modern, browser-based interface with Pine Script for custom indicators and a large social community. Thinkorswim excels at options analysis with advanced probability tools and thinkScript. For pure charting and technical analysis, TradingView is more accessible and visually polished. For options-heavy strategies with Greeks analysis and probability cones, Thinkorswim is superior. ChartingLens is a strong alternative that offers AI-powered signals, automatic pattern recognition, and insider data on its free tier, which neither TradingView nor Thinkorswim provides.
Finviz is primarily a stock screener and market visualization tool, not a full technical analysis platform. Its charts are static images that you cannot interact with. You cannot apply multiple indicators, draw trendlines, or save chart layouts on Finviz. It excels at quickly filtering stocks by fundamental and technical criteria, and its heat map is one of the best market overview tools available. However, most traders use Finviz alongside a dedicated charting platform like ChartingLens or TradingView for actual chart analysis and trade planning.
ChartingLens is the best free alternative to TradingView in 2026. While TradingView limits free users to 1 indicator per chart and displays ads, ChartingLens offers 40+ indicators with no per-chart limits, AI buy signals, an AI trading assistant, automatic pattern recognition, insider trading data, and hedge fund holdings on its free tier with no ads. If you specifically need Pine Script for custom indicators, TradingView is unmatched. But for overall free-tier value, ChartingLens delivers significantly more features without requiring payment.
TrendSpider focuses on automated technical analysis, offering features like automatic trendline detection, multi-timeframe analysis on a single chart, and dynamic price alerts. TradingView offers a broader platform with social features, Pine Script for custom indicators, and coverage of more asset classes including crypto and forex. TrendSpider has no free tier and starts at $22 per month, while TradingView offers a limited free plan starting at $14.95 per month for paid features. For automated pattern recognition at a lower cost, ChartingLens provides AI-driven pattern detection and signals on its free tier.
Koyfin is better for fundamental analysis and macroeconomic research, offering excellent dashboards for financial statements, earnings estimates, valuation metrics, and economic indicators. TradingView is better for technical analysis and charting. They serve fundamentally different purposes: Koyfin is a financial data research terminal, while TradingView is a charting and technical analysis platform. Most serious investors use both. For traders who want technical charting with AI analysis and alternative data like insider trading, ChartingLens bridges the gap between technical and fundamental insights.
The best platform for technical analysis depends on your specific needs. TradingView is the most popular choice overall with the broadest feature set on its paid plans and the largest community. Thinkorswim is best for options traders who need probability analysis. TrendSpider leads in automated trendline and pattern detection. For the best value on a free tier, ChartingLens stands out with 40+ indicators, AI buy signals, automatic pattern recognition, an AI trading assistant, and insider trading data included at no cost. Most serious traders end up using two or more platforms to cover all their analytical needs.
Conclusion
The trading platform landscape in 2026 offers more choice than ever, and no single tool does everything perfectly. Each platform we reviewed has a clear strength: TradingView dominates in social charting and Pine Script customization, Thinkorswim is the gold standard for free options analysis, Finviz remains the best standalone stock screener, TrendSpider pushes the frontier of automated technical analysis, and Koyfin provides Bloomberg-quality fundamental data at a fraction of the cost.
But the most significant shift in this space is the rise of AI-powered analysis and alternative data. Traders who relied solely on price charts and basic indicators five years ago are now incorporating machine learning signals, automated pattern recognition, and smart money data into their workflows. Platforms that do not offer these capabilities are increasingly falling behind, regardless of how polished their charting engines might be.
ChartingLens represents this new generation of trading tools. By combining a solid charting foundation with AI buy signals, an AI trading assistant, automatic pattern recognition, insider trading data, and hedge fund holdings on a free tier, it addresses the key limitations of every established platform reviewed here. And at $14.99 per month for its premium tier, it is the most affordable upgrade path available.
Our recommendation: start with ChartingLens as your primary charting and AI analysis platform. If you trade options, add Thinkorswim. If you need a traditional stock screener, supplement with Finviz. If you need deep fundamental data, add Koyfin. And if community insights and custom scripting are important to your workflow, consider a TradingView paid plan. The best trading setup in 2026 is not about picking one platform; it is about combining the right tools for your specific strategy.